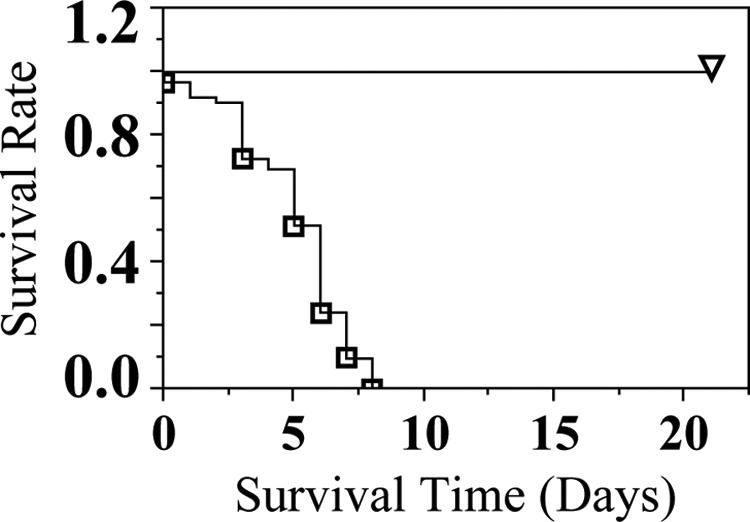
Figure 3.

Experiment IIa: survival of neonates raised by dams (n = 5 litters per treatment group) exposed to 0.5% w/w TCC treatment from GD 5 through lactation (∇: born to and raised by control dams and □: born to and raised by 0.5% w/w treated dams). All offspring born to and nursed by control dams survived until weaning. Data were analyzed with Kaplan-Meier survival analysis. Statistical significance was set at P < .05. TCC indicates triclocarban; GD, gestational day.
