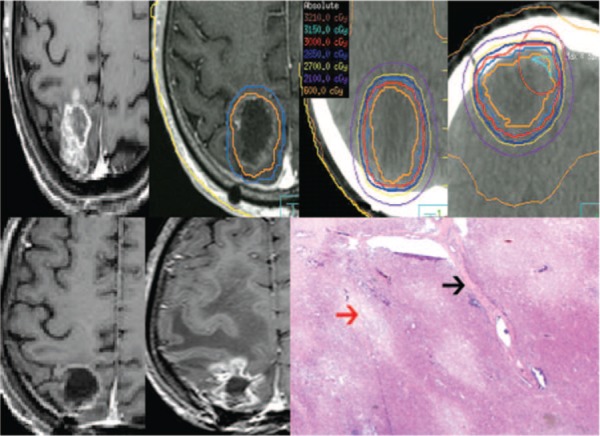
Figure 3:

Radiation necrosis post-HCSRT in a patient previously treated with WBRT. The top left is the pre-operative metastases secondary to lung cancer followed by the post-operative MRI with the CTV (orange) and PTV (blue) delineated. The subsequent top panel images illustrate the treatment planning CT with representative isodose lines on the axial and coronal images. The bottom panel left-most image shows the 12 month post-HCSRT axial MRI and the 13 month MRI taken as a result of symptoms of increased intra-cranial pressure that was surgically resected and proven to be RN. The bottom right image is a low power H&E stained histology photomicrograph showing well circumscribed areas of necrosis of the brain parenchyma (red arrow) and vascular hyalinization (black arrow) with no evidence of residual or recurrent tumor.
