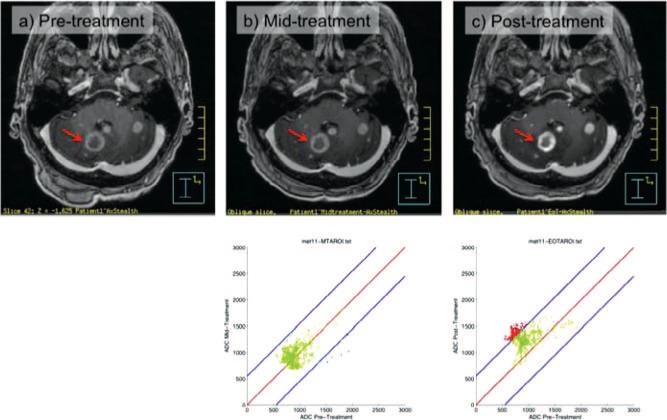
Figure 4:
MR images at various stages of radiotherapy: (A) before radiotherapy, (B) mid-treatment and (C) post-treatment. The graphs in B and C show the voxel-by-voxel ADC values changing as determined during ADC image analysis on MRI. Green points on the graph indicate no change in ADC for a voxel from the baseline to the assessment time point, while red points indicate that the ADC in a voxel has increased compared to the baseline, and blue points indicate that it has decreased compared to the baseline.

