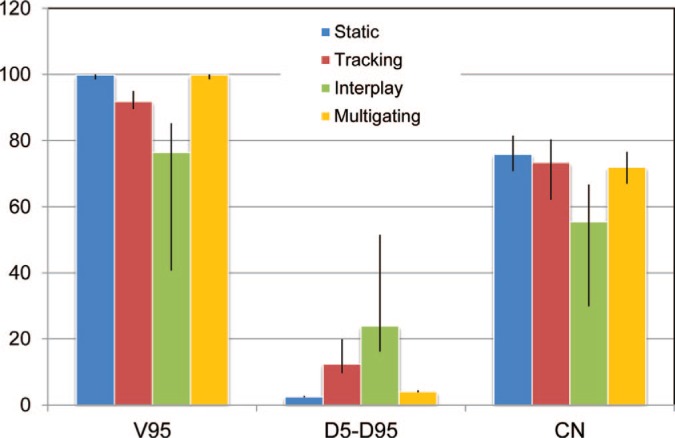
Figure 6:

DVH results (median and range) of the treatment planning study, with dose coverage (V95), homogeneity (D5-D95), and conformation (CN). All data is given as percent of the target dose or volume as appropriate. Multigating restored dose coverage to the level of the static dose at the cost of slightly worse conformity.
