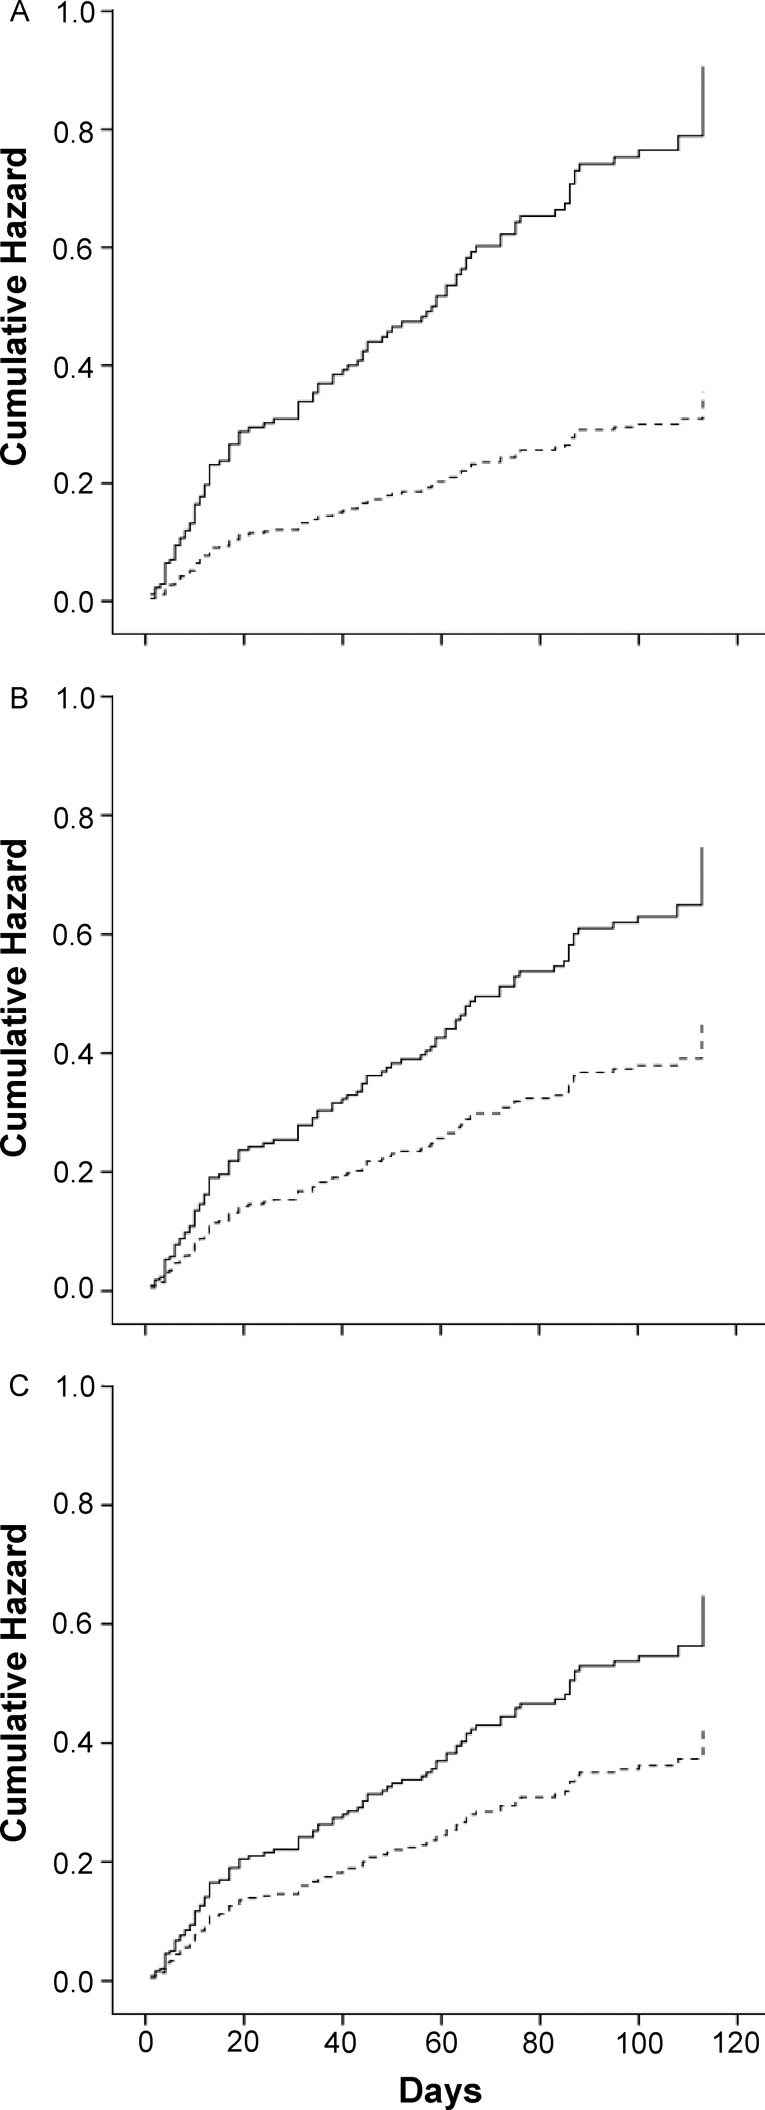
Figure 5.
Cox regression equation prediction of injury hazard for high-risk (solid lines) versus low-risk (dashed lines) status for each factor (adjusted for the effects of the other 2 factors included in the 3-factor model). A, Starter (high risk: ≥1 game). B, Oswestry Disability Index (high risk: score ≥4). C, Wall-sit hold (high risk: time ≤cut point specific to test version).

