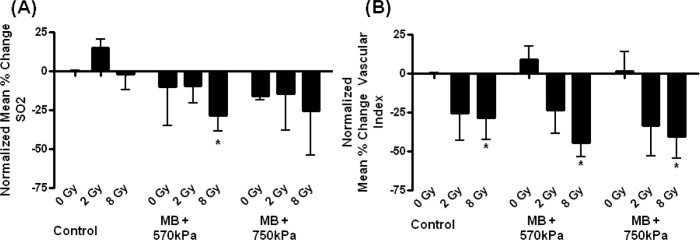
Figure 2:

(A) Photoacoustic data showing percentage change in oxygen saturation (SO2) per condition tested following treatment with a P = 0.036, using one-way ANOVA. (B) Power doppler data showing percentage change in blood flow per condition tested following treatment, where 8 Gy (P < 0.0139), MB (570 kPa) + 8 Gy (P < 0.0011), and MB (750 kPa) + 8 Gy (P < 0.015) were significantly reduced when compared to the control. The T-test was used to analyze photoacoustic and power doppler data. Asterisks indicate differences compare to control. Error bars indicate standard errors of the mean.
