Figure 3:
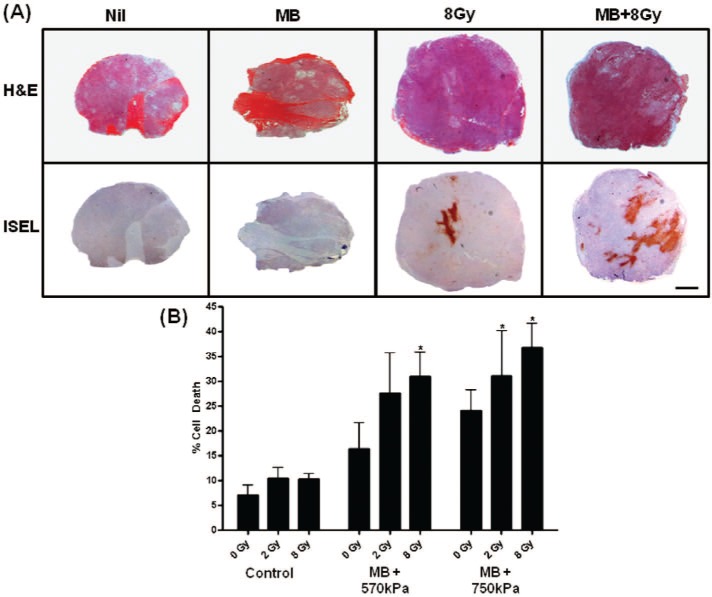
(A) Evaluation of cell death in representative sections of PC3 prostate mice xenograft tumours at low magnification. Haematoxylin and eosin (H&E, top row) and corresponding ISEL (bottom row) stained sections in rows. Columns represent conditions; no treatment (control), ultrasound-stimulated microbubbles with 750 kPa ultrasound only (MB), 8 Gy radiation only (XRT), and combined ultrasound-stimulated microbubble with 750 kPa and 8 Gy treatment. Control and MB samples demonstrate few diffuse areas of cell death. The 8 Gy treated sample demonstrates small diffuse areas of cell death with a large area of cell death centered in the middle. When microbubbles and radiation are combined, the areas of cell death appear enlarged and the center area of cell death becomes larger and more concentrated. Note the enhancement of cell death in the MB + 8 Gy treated tumours. (B) Data illustrating percentage of cell death, where one-way ANOVA testing indicated a significant difference with P = 0.0103. Specific differences were also observed using E-test, when comparing the combined treatments of MB (750 kPa) + 2 Gy (P < 0.04), MB (570 kPa) + 8 Gy (P < 0.005) and MB (750 kPa) + 8 Gy (P < 0.002) to the control. The scale bar indicates 1 mm. Error bars indicate standard error of the mean.

