Abstract
Spatial frequency spectra from cervical intraepithelial neoplasia (CIN) tissues are used to detect differences among different grades of human cervical tissues. The randomness of the structures of tissues from normal to different stages of CIN tissues is recognized by analyzing the spatial frequency. This study offers a simpler and better way to recognize the alterations among normal and different stages of CIN tissue, which are reflected by spatial information containing within the periodic or random structures of different types of tissue.
Keywords: Spatial frequency spectra, Cervical Intraepithelial Neoplasia, Stromal region, Fourier analysis
Introduction
Spatial frequency spectrum is considered to be able to yield fingerprint information about the surface and internal structures of samples. It can provide spatial information from the periodic and random structures of the sample from the spatial intensity distribution. It is well known that an image plane with the light intensity distribution is composed of spatial frequencies, which is similar to a time domain signal composed of various frequencies (1). The spatial frequency can be obtained by a Fourier transform analysis of the light intensity distribution to determine how many frequencies are contained in the waveform in terms of spatial frequencies for unit of cycles per unit distance. Cervical dysplasia, e.g. cervical intraepithelial neoplasia (CIN), is potentially premalignant tissue with abnormal squamous cells on surface of cervix (2). Although not a cancer, above 12% of CIN cases progress to become cervical cancer if left untreated (2). Others cause warts. Cellular changes and disorder of tissue structure are associated with the stages of CIN, which is classified in three grades (2). Usually cervical tissue has order and well-defined cell structure in its normal stage (2). When tumorigeness begins, the tissue becomes distorted, random, and structure-reducing. The current techniques for CIN detection include the Papanicolaou or Pap smear and colposcopy. To make a definite diagnosis of cervical dysplasia, a biopsy should be taken of any abnormal appearing areas (2).
Optical techniques provide alternative methods which have the potential to diagnose disease such as cancer without removing tissue. The main components like collagen within the stromal region of organs may alter polarization due to birefringence, optical activity, and attenuation because of tumor evolution. The uses of polarization change (3) and concerted spatial-frequency filtration of images of histological sections in Fourier plane (4) have been proposed for early cancer diagnostics by several groups of researchers.
This paper describes an innovative approach to use spatial frequencies to characterize fluorescent images of stromal region of a tissue section to distinguish normal and different stages of CIN tissues by utilizing the spatial frequency spectra information provided by the two dimensional (2D) light intensity distributions from underlying tissue structure. Since the periodic structure of collagen in the stromal region of tissue gets disordered (2, 5) with progress in the grade of CIN, the spatial frequency spectra of these tissues may offer a new way to analyze the stage from normal and neoplasia to invasive carcinoma.
Methods
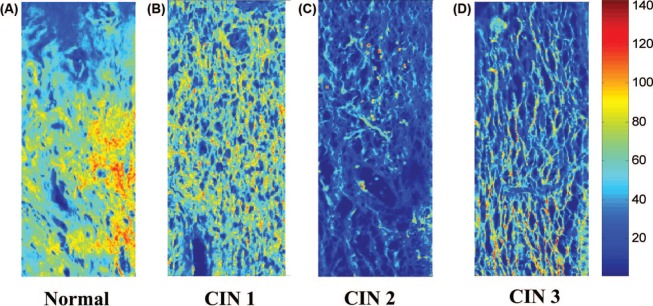
Totally seven sets of 5 pm thick tissue sections of human cervix of normal, CIN 1, CIN 2, and CIN 3 tissues stained by haematoxylin and eosin (H&E) are used in this study. Histopathologist classifies cervix tissues in various grades of dysplasia based on an observation only from the epithelial region whereas it is also known that gradual breakage of collagen crosslinks in the stromal region also correspond to the different grades (2, 6). The tissues sections were irradiated by 514 nm wavelength of an argon ion laser and fluorescence images were captured at emission wavelength 532nm using a confocal microscope (Leica TCS SP5). A set of typical images of stromal region near basal layer are shown in Figure 1 (A), (B), (C), and (D) for the normal, CIN 1, CIN 2, and CIN 3 cervical tissues, respectively. The spatial frequencies of the stromal regions of the images are then analyzed to denote the variation of the structure in the different grades. The images can be expressed as 2D functions fx, y) in spatial coordinates (x, y), which describe how intensities or color values (in our case) vary in space.
Figure 1:

Cropped portions of typical confocal microscope fluorescence images of stroma of (A) normal, (B) CIN 1, (C) CIN 2, and (D) CIN 3 cervical tissues.
In general, a Fourier series representation of a 2D function, f(x, y), can be expressed as (7):
| 1 |
where u and v are the numbers of cycles fitting into one horizontal and vertical periods of f(x, y) with a period Lx and Ly in the x and y directions, respectively. Converting the 2D spatial function f(x, y) into the 2D spectrum F(u, v) of spatial frequencies, Fast Fourier Transform (FFT) is usually used mathematical tool without loss of information. In general case, Fourier series of f(x, y) should be considered as an infinite pair of the 2D arrays of coefficients. In the algorithms of digital signal processing (DSP), the Discrete Fourier Transform (DFT) of a finite extent N × N sampling of 2D intensity distribution is usually used (7):
| 2 |
Equation [2] can be simplified as (8):
| 3 |
where R(u, v) and I(u, v) are the real and imaginary parts, respectively; and important information such as the magnitude spectrum, |F(u, v)| can be obtained by calculating each complex coefficient F(u, v) (8):
| 4 |
Results and Discussions
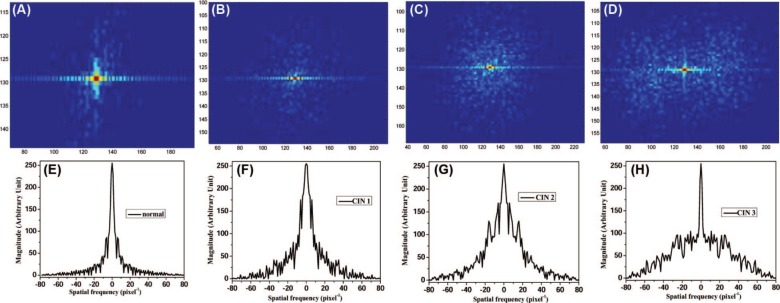
In order to obtain the information of discontinuity and aperiodicity for cervical tissue of different CIN grades, the DFT of images shown in Figure 1 was achieved using Origin 8.5 built-in function by sampling N = 256. The 2D amplitude spectra of stromal region of normal, CIN 1, CIN 2, and CIN 3 cervical tissues are shown as Figure 2 (A-D), respectively. For the visual purpose, 2D amplitude spectra shown in Figure 2 were obtained with the truncated linear mapping of the initial amplitudes and the logarithms of amplitudes (9) in the color range of [0 to 255].
Figure 2:

Spatial frequency of (A) normal, (B) CIN 1, (C) CIN 2, and (D) CIN 3 tissues using 2D Fourier transform of their corresponding confocal microscope images; (E-H) are obtained by the digital spatial cross section frequency distributions at the most dominant frequency along horizontal direction of (A-D), respectively.
The spatial frequencies shown in Figure 2 (A-D) are typical results of 2D DFT where the dominant spatial frequency is at the origin - zero frequency (u = 0, v = 0), and increases in all directions away from the center (9). The salient differences among Figure 2 (A-D) observed are that more higher frequency components exist in stromal region of CIN tissues than those in normal tissue, as well as more higher frequency components in higher grade CIN tissue than those in lower grade CIN tissue. The features displayed by Figure 2 can be summarized as: (i) for the normal tissue and the lower grade CIN tissues, the lower frequency amplitudes dominate over the mid-range and high-frequency ones; and (ii) the midrange and high-frequency amplitude spectrum can be perceived more and more clearly with the evolution from normal to CIN tissue, and development from low grade to high grade CIN. These differences among the different types of tissues can be more clearly seen from their spatial frequency distributions at the same pixel row crossing the areas of the most dominant frequency along the horizontal direction. Figure 2 (E-H) show frequency distributions of the Figure 2 (A-D) at the most dominant frequency along the horizontal direction, respectively. The spatial frequency spectra of different types of tissue show that higher the grade of CIN tissue, more and wider the spatial frequency range. This observation is in good agreement as the cervical tumor development (2).
Depending on features or factors such as the location of the infection, CIN can start in any of the three stages, and can either progress, or regress (2). CIN 1 is the least risky type, confined to the basal 1/3 of the epithelium; CIN 2 is the moderate neoplasia confined to the basal 2/3 of the epithelium; and CIN 3 is the severe one spanning more than 2/3 of the epithelium, and may involve the full thickness of the epithelium. The lesion of CIN 3 may sometimes be referred to as cervical carcinoma in situ. The patterns of normal tissues consist of evenly placed uniform epithelia cells supported by a wellstructured surrounding extracellular matrix (ECM), which is composed mainly by collagen (6). With grade advances, the tumor cells proliferate thus degrade ECM and cause the loss and randomness of collagens (6).
The images here were taken in the stromal region of cervical tissue sections, where the collagen in the normal tissue is more ordered in layers and uniform in shape and size while those in CIN tissues are aperiodic random, anti-symmetrical, different sizes, and disordered in structure with more structure parameters. This is the reason why higher grade CIN tissues cover a wider spatial frequency range in comparison with lower grade CIN and normal cervical tissues.
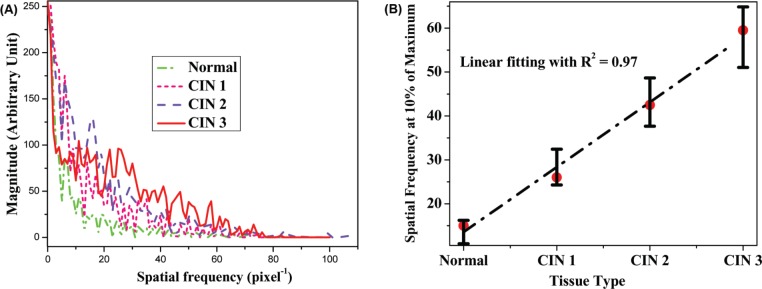
The differences in spatial frequency distributions among normal and different grade CIN tissues levels may be directly exposed by plotting all their spatial frequencies in the same graph. Figure 3 (A) shows spatial frequency distributions of normal (dash-dot), CIN 1 (short dash), CIN 2 (dash), and CIN 3 (solid) tissues, respectively. It can be seen from Figure 3 (A) that there is an increase of spatial frequency range from normal to CIN tissues, as well as from low grade CIN to high grade CIN tissues. In spectral analysis, the expanding range refers to more frequency components. This phenomenon is also rendered as “whitening of signal” (8, 9). The whitening of spatial frequency of CIN tissues compared with normal tissue may provide a diagnostically criterion for grading CIN tissues.
Figure 3:

(A) Comparison of the differences of spatial frequency distributions of normal (dash-dot), CIN 1 (short dash), CIN 2 (dash), and CIN 3 (solid) tissues; (B) the levels of whitening of the spatial frequency as a function of normal and CIN grade.
In order to evaluate this potential, Figure 3 (B) shows the width of range for the spatial frequency from the full maximum decreasing to 10% of the maximum as a function of normal and CIN grade. It is important to note that the “whitening of the spatial frequency” exhibits a monotonous growth with the CIN grades. It can be seen that there is a parallelism between CIN grades and levels of whitening of the spatial frequency. This linear dependence can be schematically shown as the dash-dot line in Figure 3 (B), which can be characterized by correlation coefficient: R2 = 0.97, using linear regression analysis of these two groups of data. (The normal tissue is taken as grade 0.) The trend of whitening of the spatial frequency increasing with the CIN grades was observed as well in other six of the seven sets of CIN tissues investigated in this study. Moreover, the features of disorder, aperiodic random, anti-symmetrical collagens in different size are hallmarker of prostate (10, 11), breast (12, 13), and other types of dysplasia and/or tumor; therefore, this technique has the potential to be applied in other types of cancer detection.
By using a compact fiber-optic second harmonic generation (SHG) scanning endomicroscope, Zhang et al. demonstrate its utility for monitoring the remodeling of cervical collagen in mice (14). This study indicates the spatial frequency analysis has potential to be advanced into in vivo diagnostics without taking tissue samples in the hollow organ, such as cervical, esophagus, gynecologic, or colon cancer. With the help of SHG endomicroscope, it is possible to visualize collagen fiber, cellular nuclei, and other tissue structures in vivo (14). These data provide the information of morphologic changes due to the tumor, which can be obtained by spatial frequency analysis. This research will be important for clinical and histological analysis as an alternate tool in vivo to evaluate tissue structure coded by spatial frequency. It is envision that spatial frequency analysis has potential to be used to evaluate the state of the tissue of normal, inflammation, precancer or cancer in situ in the near future (14, 15).
Conclusion
In conclusion, this pilot investigation on sets of human normal, CIN 1, CIN 2, and CIN 3 tissues sections using Fourier analysis of their confocal microscope fluorescence images shows potential to obtain diagnostic information from the spatial frequency distributions of these samples. With the evolution from normal to CIN tissues and the development from low grade to high grade CIN tissues, the whitening of the spatial frequency was observed. This can be understood by more ordered layers of collagen of uniform shape and size in the normal and low grade CIN tissue, but aperiodic random, anti-symmetrical, differently sized, and disorderedstructure collagen in high grade CIN tissue. This study in vitro shows that it is possible to discriminate the normal and three grades of CIN tissues. Further, based on whitening of the spatial frequency as a function of CIN grade, a spatial spectral grading in parallel with CIN grading could be established with a linear fit in excess of 0.90. This pilot work will expand the use of Fourier analysis into the field of biomedical optics for cancer research.
Acknowledgement
This research is supported in part by the City College of New York (CCNY) President Seed program, U. S. Army Medical Research and Material Command (USAMRMC) under grant of # W81XWH-11-1-0335 (CUNY RF # 47204-00-01), and CARE project from Indian Institute of Technology (IIT) at Kanpur. Authors would also like to acknowledge Dr. A. Agarwal and Dr. C. Pantola from Ganesh Shankar Vidyarthi Memorial Medical College, Kanpur, UP, India for providing tissue sections and fruitful discussion on histopathology.
Abbreviations
- CIN:
Cervical Intraepithelial Neoplasia
- FFT:
Fast Fourier Transform
- DFT:
Discrete Fourier Transform
References
- 1. Goodman J. Introduction to Fourier Optics. Third Edition, Roberts & Company, ISBN 0-9747077-2-4, Copyright @2005. [Google Scholar]
- 2. Hoffman B, Schorge J, Schaffer J, Halvorson L, Bradshaw K, Cunningham F. Williams Gynecology, Second Edition McGraw-Hill Professional, ISBN 978-0-07-171672-7, Copyright @2012. [Google Scholar]
- 3. Tang GC, Wang WB, Pu Y, Alfano RR. Optical birefringence of aorta tissues. Proceedings of SPIE 7561 (SPIE, Bellingham, WA 2010: ), 756116 (2010). [Google Scholar]
- 4. Angelsky OV, Ushenko AG, Ushenko YG. 2D Stokes polarimetry of biospeckle tissues images in preclinic diagnostics of their precancer states. J Holography Speckle 2, 1–8 (2005). DOI: http://dx.doi.org/10.1166/jhs.2005.006 [Google Scholar]
- 5. Das N, Chatterjee S, Soni J, Jagtap J, Pradhan A, Sengupta TK, Panigrahi PK, Vitkin IA, Ghosh N. Probing multifractality in tissue refractive index: prospects for precancer detection. Opt Lett 38(2), 211–213 (2013). DOI: 10.1364/OL.38.000211. [DOI] [PubMed] [Google Scholar]
- 6. Pu Y, Wang WB, Yang YL, Alfano RR. Stokes Shift Spectroscopic analysis of multi-fluorophores for human cancer detection in breast and prostate tissues. J Biomed Opt 18(1), 017005–1-8 (2013). DOI: 10.1117/1.JBO.18.1.017005. [DOI] [PubMed] [Google Scholar]
- 7. Efford N. Digital Image Processing: A Practical Introduction Using Java™. Pearson Education, Addison-Wesley, ISBN-13: 9780201596236, Copyright ©2000. [Google Scholar]
- 8. Saleh BEA, Teich MC. Fundamentals of Photonics, Chapter 2, Fourier Optics. John Wiley & Sons, Inc., ISBN 978-0-471-35832-9, Copyright ©2007. [Google Scholar]
- 9. Chung S, Legge G, Tjan B. Spatial-frequency characteristics of letter identification in central and peripheral vision. Vision Res 42(18), 2137–152 (2002). DOI: 10.1016/S0042-6989(02)00092-5. [DOI] [PubMed] [Google Scholar]
- 10. Gleason DF, Mellinger GT. Prediction of prognosis for prostatic adenocarcinoma by combined histological grading and clinical staging. J Urol 111, 58–64 (1974). DOI: 10.1016/s0022-5347(02)80309-3. [DOI] [PubMed] [Google Scholar]
- 11. Pu Y, Wang WB, Yang YL, Alfano RR. Stokes shift spectroscopy highlights differences of cancerous and normal human tissues. Opt Lett 37(16), 3360–3362 (2012). DOI: 10.1364/OL.37.003360. [DOI] [PubMed] [Google Scholar]
- 12. Bloom HJG, Richardson WW. Histological grading and prognosis in breast cancer; a study of 1409 cases of which 359 have been followed for 15 years. Br J Cancer 11(3), 359–377 (1957). DOI:10.1038/bjc.1957.43. [DOI] [PMC free article] [PubMed] [Google Scholar]
- 13. Pu Y, Wang WB, Yang YL, Alfano RR. Native fluorescence spectra of human cancerous and normal breast tissues analyzed with nonnegative constraint methods. Appl Opt 52(6), 1293–1301 (2013). DOI: 10.1364/AO.52.001293. [DOI] [PubMed] [Google Scholar]
- 14. Zhang YY, Akins ML, Murari K, Xi J, Li M, Luby-Phelps K, Mahendroo M, Li X. A compact fiber-optic SHG scanning endomicroscope and its application to visualize cervical remodeling during pregnancy. P Natl Acad Sci USA 109, 12878–12883 (2012). DOI: 10.1073/pnas.1121495109. [DOI] [PMC free article] [PubMed] [Google Scholar]
- 15. Guo Y, Savage HE, Liu F, Schantz SP, Ho PP, Alfano RR. Subsurface tumor progression investigated by noninvasive optical second harmonic tomography. P Natl Acad Sci USA 96, 10854–10856 (1999). [DOI] [PMC free article] [PubMed] [Google Scholar]


