
Figure 2:
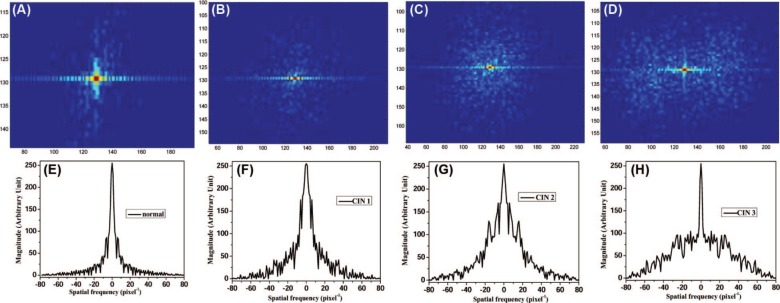
Spatial frequency of (A) normal, (B) CIN 1, (C) CIN 2, and (D) CIN 3 tissues using 2D Fourier transform of their corresponding confocal microscope images; (E-H) are obtained by the digital spatial cross section frequency distributions at the most dominant frequency along horizontal direction of (A-D), respectively.