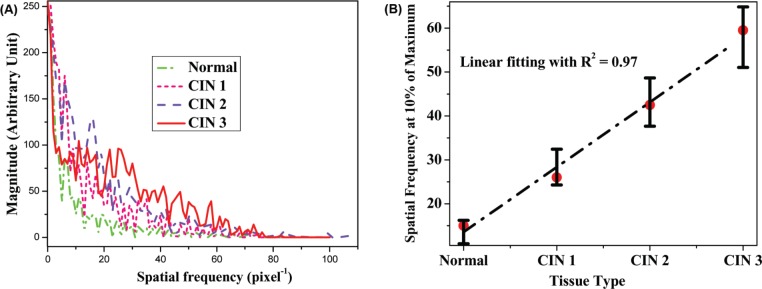
Figure 3:

(A) Comparison of the differences of spatial frequency distributions of normal (dash-dot), CIN 1 (short dash), CIN 2 (dash), and CIN 3 (solid) tissues; (B) the levels of whitening of the spatial frequency as a function of normal and CIN grade.
