
Figure 3:
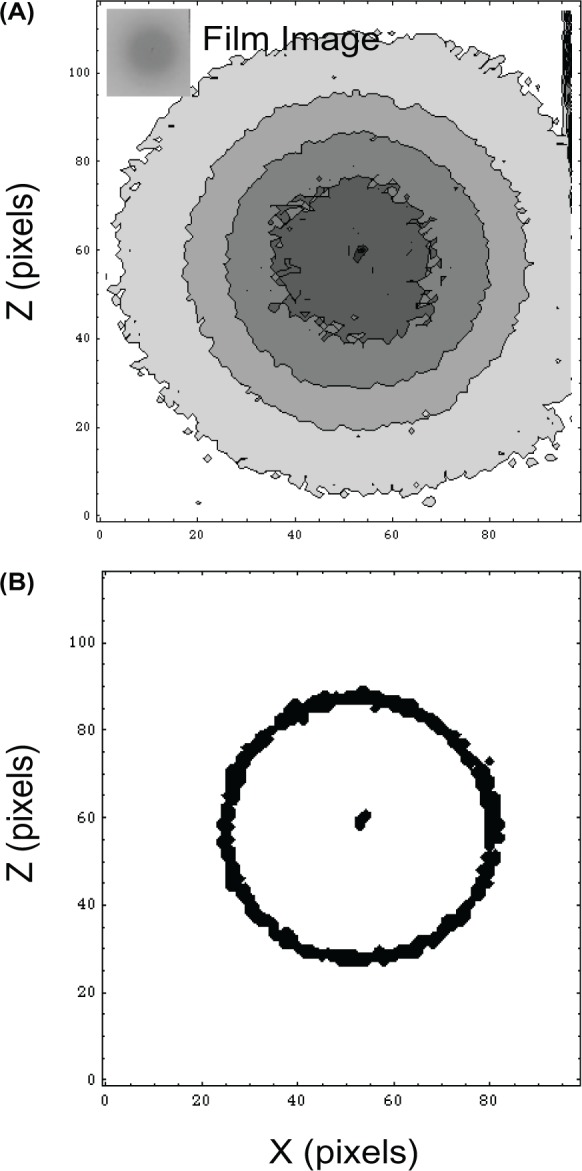
Illustration of an eXtend patient treatment case results showing (A) the original unfiltered film with the pin-mark at the center (B) the extracted isodose plot, and the peripheral isodose band (approximately 40-60% of the central dose) and the central pin-marked area. The scale of the plots is 0.2 mm. No smoothing and edge enhancing filters were used for this procedure. Instead, the mean center-of-mass (CM) position was determined for the central marking area and the peripheral isodose band. The discrepancy between the two CM positions was found to 0.36 ± 0.03 mm for repeated measurements. The result was insensitive to high background noise and the selection of the peripheral isodose band.