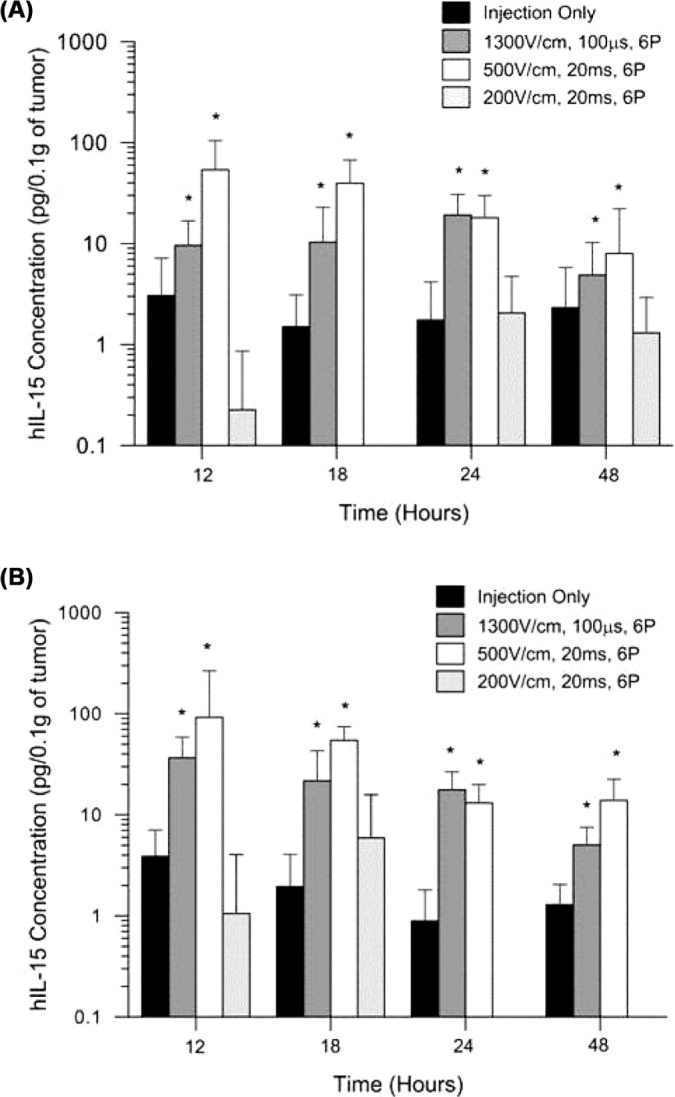
Figure 1:

Analysis of tumor homogenate for hIL-15 expression after a single delivery of phIL-15. Expression of hIL-15 was measured by ELISA at 12, 18, 24, and 48 hours after a single intratumoral delivery of 50 |il of phIL-15 at a concentration of 1.0 mg/ml (A) or at a concentration of 2.0 mg/ml (B) using electroporation with various parameters delivered by a circular 6 penetrating electrode array. Data is represented as the mean hIL-15 concentration (pg/0.1g of tumor). Error bars represent standard deviation. Student f-test was performed to calculate significance for each group compared to injection only at that time point. The number of animals in each group tested were between 8 and 16. P pulses; *p value < 0.05. No samples were tested at 24 and 48 hours for mice that received phIL-15 with six 20 ms pulses at 200 V/cm.
