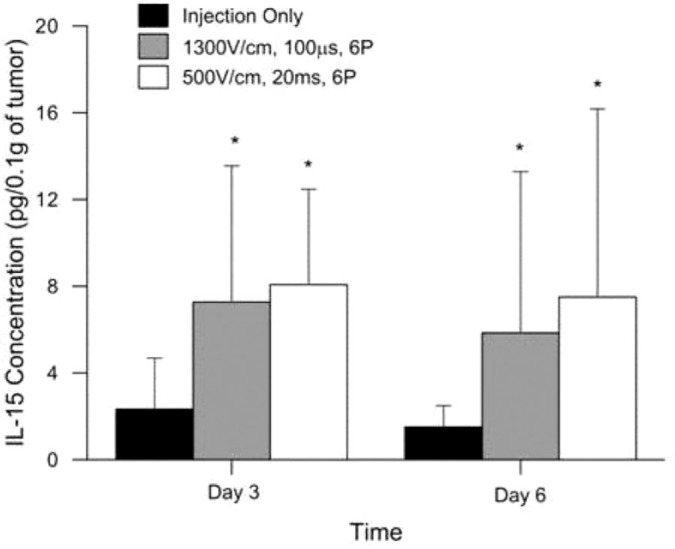
Figure 2:

Analysis of tumor homogenate for hIL-15 expression after a multiple deliveries of phIL-15. Expression of phIL-15 was measured by ELISA 12 hours after two intratumoral deliveries of 50 |il of phIL-15 (2.0 mg/ml) on days 0 and 3 and 12 hours after three deliveries of 50 |il of phIL-15 (2.0 mg/ml) on days 0, 3, and 6 using electroporation with various parameters delivered by a circular 6 penetrating electrode array. Data is presented as the mean hIL-15 concentration (pg/0.1 g of tumor) over time. Error bars represent standard deviation. Student f-test was performed on each sample and significance calculated based on the injection only group at each time point. n = 12 for each group tested. P pulses; *p value < 0.05.
