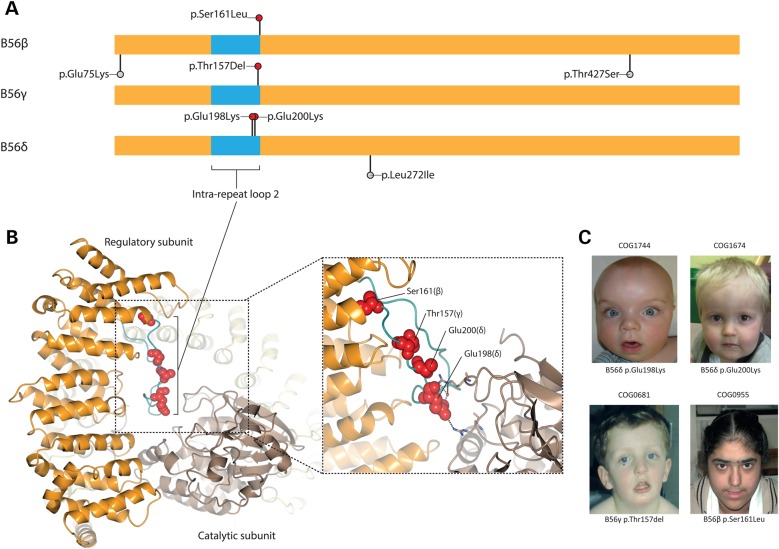
Figure 1.
PP2A-B56 mutations in human overgrowth. (A) Protein schematic showing the distribution of PP2A-B56 subunit mutations in individuals with overgrowth (above, red lollipops) versus variants identified in the ICR1000 control series (below, grey lollipops). The shared core B56 domain is shown in orange and the intra-repeat loop 2 region in blue. (B) PP2A-B56 subunit mutations mapped onto the PP2A-B56γ complex. PP2A-B56γ is shown in orange, the catalytic subunit is in light brown and the scaffold subunit is in yellow. The intra-repeat loop 2 of PP2A-B56γ is highlighted in blue. The residues corresponding to the mutations identified are shown as red spheres. Inset: interaction of PP2A-B56γ p.Glu153 with the PP2A-Cα subunit. The glutamate side chain forms an ion pair interaction and water-mediated H-bonds to Arg residues from the catalytic subunit. (C) Facial characteristics of individuals with PP2A-B56 subunit mutations. Growth parameters and clinical features are described in Table 1. Specific consent to publish facial photographs was obtained for all individuals.

