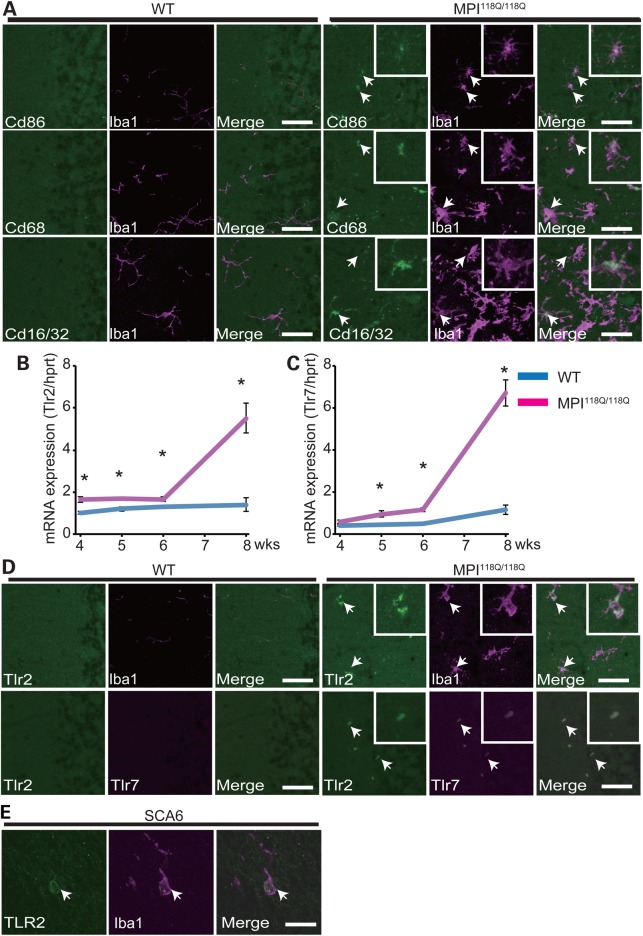
Figure 3.
Characterization of activated microglia in the cerebellum of the MPI118Q/118Q mice. (A) Double-immunofluorescence analysis of a microglial marker Iba1 and activated microglial marker (Cd86, Cd68 and Cd16/32) antibodies, stained cerebellar section of a 6-week-old MPI118Q/118Q mouse. (B–D) The infiltrating microglia express Tlr2 and Tlr7 in the Sca6 model. The scale bars indicate 50 μm. (B) qPCR analysis of Tlr2 in the MPI118Q/118Q cerebellum at 4, 5, 6 and 8 weeks of age. (C) qPCR analysis of Tlr7 in the MPI118Q/118Q cerebellum at 4, 5, 6 and 8 weeks of age. The asterisks indicate a statistically significant difference (P < 0.05). The error bars represent standard errors. (D) Co-immunofluorescence studies of the microglial marker Iba1 with Tlr2 (top) and Tlr2 with Tlr7 (bottom). The scale bars indicate 50 μm. The arrows indicate doubly labeled cells. (E) Co-immunofluorescence studies of the microglial marker Iba1 with TLR2 in SCA6 postmortem cerebellum. The scale bars indicate 25 μm. The arrows indicate doubly labeled cells.

