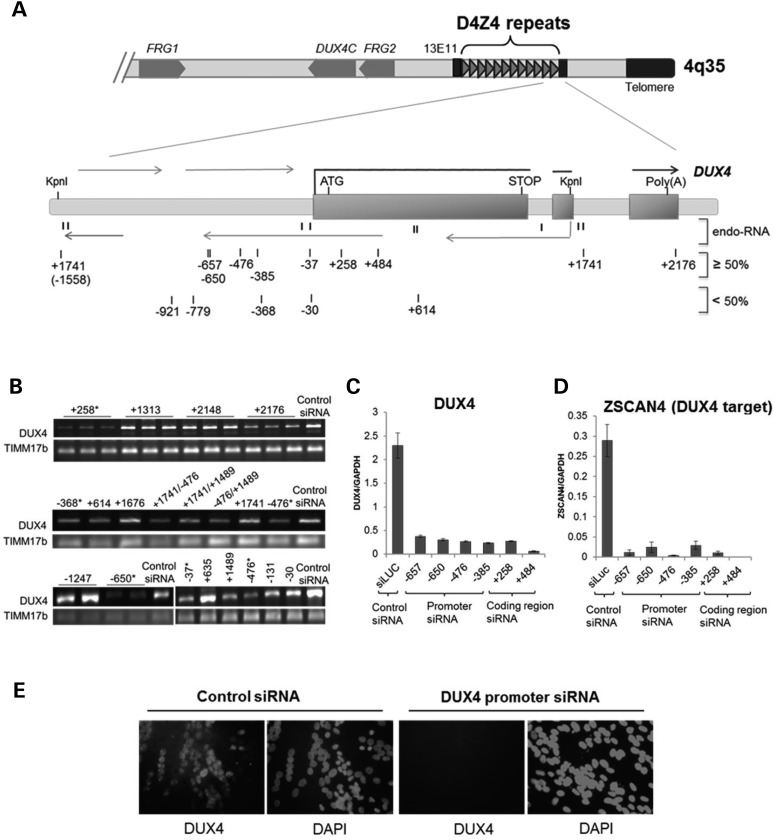
Figure 1.
Inhibition of DUX4 expression in FSHD cells by siRNAs targeting D4Z4 regions. (A) Schematic diagram of the distal tip of 4q35 showing the D4Z4 repeat region and enlargement of the distal D4Z4 unit flanked by KpnI sites and the adjacent pLAM sequence with the imbedded DUX4 gene. Exons 1–3 of DUX4 are indicated by rectangles. Thick horizontal lines correspond to the DUX4 mRNA, whereas thin horizontal lines depict multiple sense and antisense D4Z4 transcripts. Direction of transcription is indicated with arrows. Previously identified D4Z4-derived endogenous small RNAs (6) are shown by short vertical lines and indicated as endo-RNA. Numbered vertical marks show the location of exogenous duplex siRNAs targeting the D4Z4 region. siRNA numbering indicates location of the 5-prime nucleotide of the targeted sequences relative to the most promoter proximal DUX4 transcription start site (TSS = 1) (6) with all siRNAs in this figure designed to target the sense sequence relative to the DUX4 transcript (see Supplementary Material, Table S1 for each targeted sequence). Top lane shows siRNAs that efficiently reduce DUX4 mRNA levels (≥50%), and bottom lane shows less-efficient siRNAs (<50%) as determined by RT- and qRT–PCR analysis of DUX4 and DUX4 target gene expression (B and C). (B) Representative sample of RT–PCR analysis of DUX4 mRNA abundance following transient transfection of FSHD1 muscle cells with duplex siRNAs targeting D4Z4 regions as depicted in (A). TIMM17b RT–PCR on each sample serves as internal control. Biological replicates are indicated by horizontal lines above lanes; otherwise, single representative PCR results from multiple experiments are shown. Asterisk mark indicates siRNAs that were verified by qRT–PCR and selected for further investigation. (C and D) DUX4 and DUX4-target mRNA levels in FSHD2 muscle cells following transfection with the siRNAs, targeting coding and non-coding DUX4 sequences, were quantified by real-time qRT–PCR analysis (see Supplementary Material, Fig. S1 for details). DUX4 and DUX4-target qRT–PCR data were analyzed by standard curve, normalized to GAPDH and presented as mean ± SEM based on triplicate PCR reactions for each sample. (E) Immunofluorescence analysis of FSHD2 muscle cells transfected with control (siLuc) and promoter (−650) targeting siRNAs. Cells were stained with DUX4 antibody and DAPI, as indicated. Single representative images of FSHD muscle cells transfected with the control and promoter targeting siRNAs that were validated by qRT–PCR in (C) are shown. For all experiments presented in Figure 1, DUX4 or DUX4-target expression was analyzed in FSHD muscle cells 96 h post siRNA transfection and 48 h post-induction to differentiation (MB to MT 4 days time point) (see also Supplementary Material, Figs. S1 and S2).

