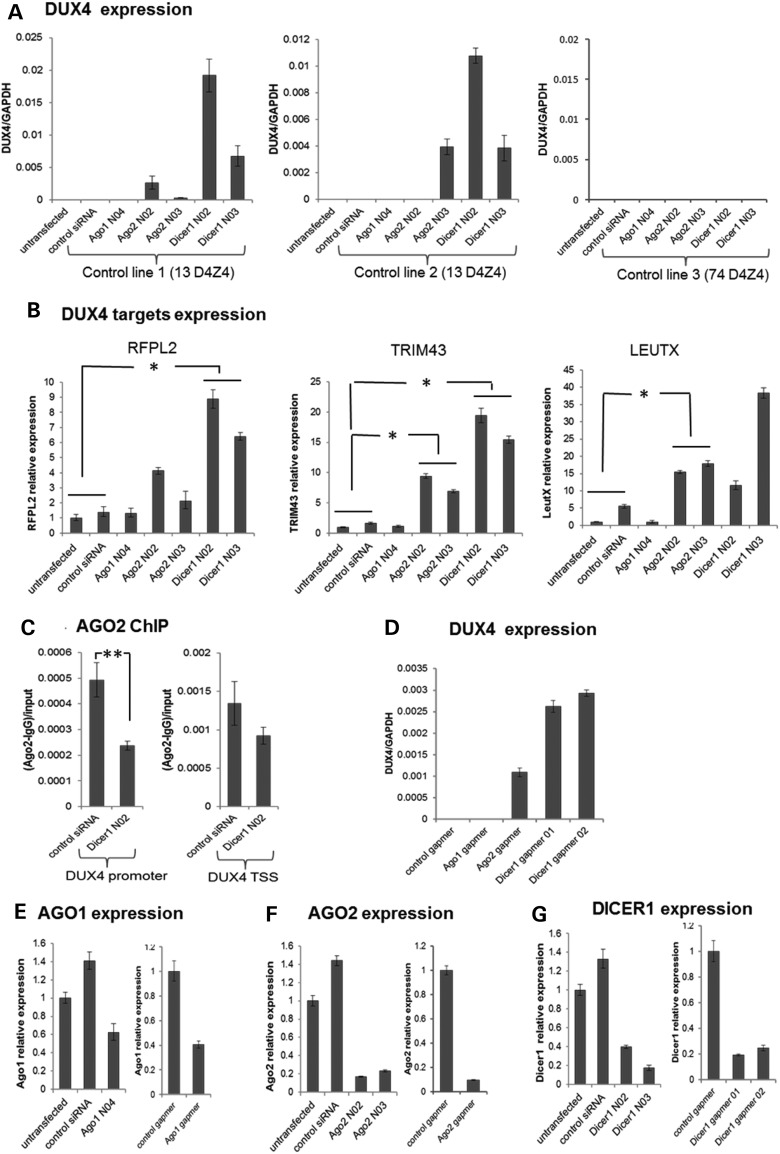
Figure 4.
AGO2 or DICER1 knockdown in control cells de-repress DUX4 expression. (A) qRT–PCR analysis of DUX4 mRNA in three control muscle cell lines following siRNA-mediated depletion of AGO1, AGO2 and DICER1. (B) qRT–PCR analysis of DUX4-target gene transcripts (RFPL2, TRIM43, LEUTX) in Control Line 1 following siRNA-mediated depletion of AGO1, AGO2 and DICER1. Myoblasts were transfected twice with the validated siRNAs targeting AGO1 (AGO1 N04), AGO2 (AGO2 N02 and N03) or DICER1 (DICER1 N02 and N03) mRNA using a double-transfection protocol with the first transfection at −96 h followed by the second transfection and induction of differentiation at −48 h prior to RNA isolation (MB to MT 4 days time point). qRT–PCR data were analyzed using standard curve method for DUX4 expression and ddCt for DUX4 target gene expression, normalized to GAPDH levels and presented as mean ± SEM based on triplicate PCR reactions for each sample. (C) ChIP-qPCR analysis of AGO2 enrichment at the DUX4 promoter and near the TSS region in control myotubes [Control line 1 in (A)] following transfection with control siRNA or DICER1 N02 siRNA. (D) qRT–PCR analysis of DUX4 mRNA in control muscle cell line 1 following depletion of AGO1, AGO2 and DICER1 using MOE-gapmers. Myoblasts were transfected twice with the gapmers using a double-transfection protocol with the first transfection at −96 h followed by the second transfection and induction of differentiation at −48 h prior to RNA isolation. qRT–PCR data were analyzed using standard curve method, normalized to GAPDH levels and presented as mean ± SEM. (E–G) AGO1, AGO2 and DICER1 mRNA levels in control line 1 following siRNA or MOE-gapmer knockdowns were analyzed by qRT–PCR by ddCt method, normalized to GAPDH and presented as mean ± SEM (see also Supplementary Material, Fig. S4). Data plotted in all panels represent the mean ± SEM based on triplicate PCR reactions. *P < 0.05; **P < 0.01. (A) and (D) lacked measurable signal in the control samples, so P-values were not calculated, see Supplementary Material, Figure S4 for Ct values from (A). (E–G) show the degree of target knockdown for the control line 1 experiment presented and P-values were not calculated. See Supplementary Material, Figure S4B for degree of AGO1, AGO2 and DICER knockdown in the control lines 2 and 3 experiments presented.

