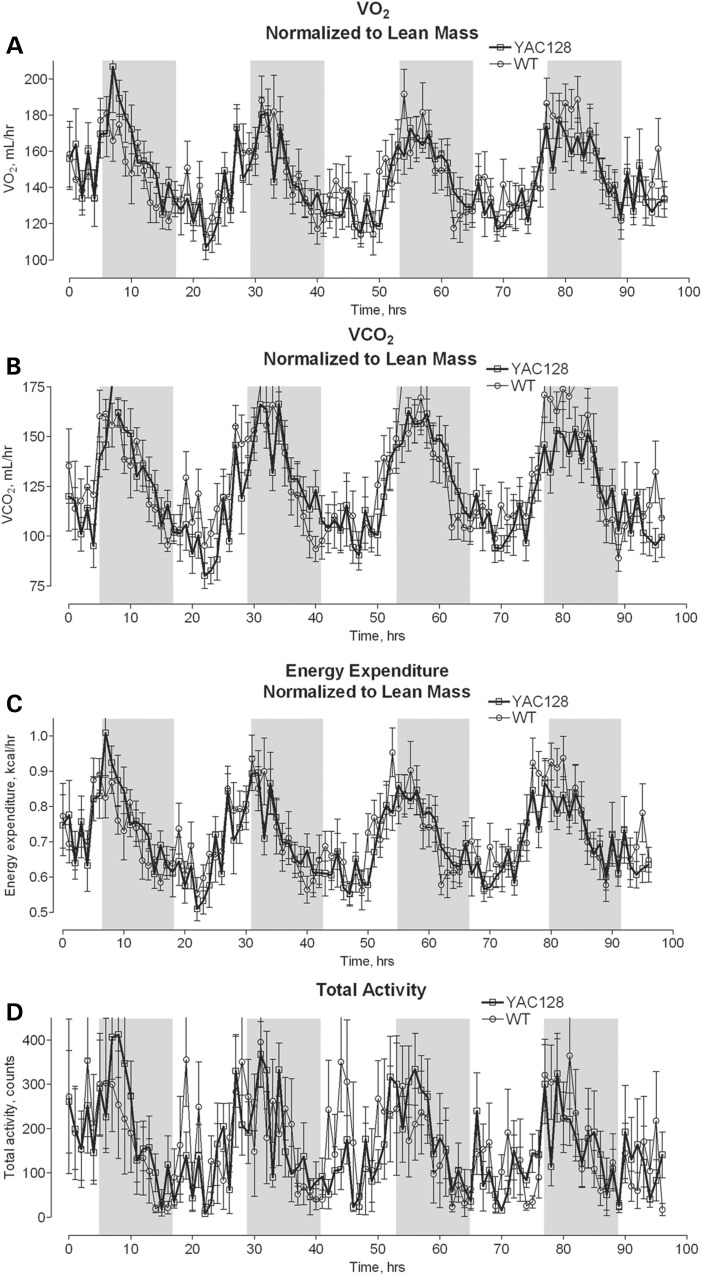
Figure 12.
Oxygen consumption (A), CO2 release (B), energy expenditure (C) and total physical activity (D) of 10-month-old YAC128 and WT mice. The animals were analyzed by indirect calorimetry in metabolic cages. Oxygen consumption, CO2 release and energy expenditure were normalized to lean mouse body mass determined by DEXA scanning. The shaded areas correspond to the 12-h dark cycles. Data are mean ± SEM, N = 8.

