
Figure 2.
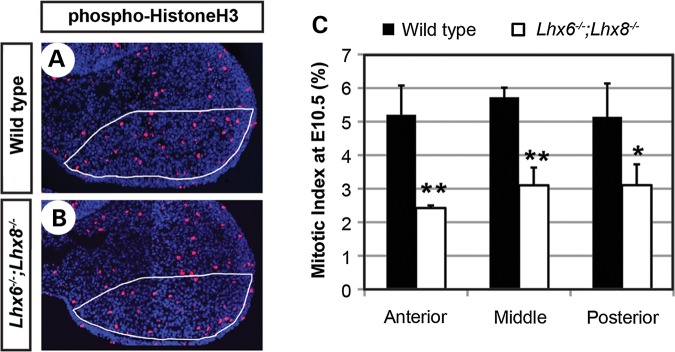
Reduced cell proliferation in the maxillary arches of Lhx6−/−;Lhx8−/− mutants. (A and B) Coronal sections of the head of E10.5 embryos stained for nuclei (blue) and phospho-Histone H3 (red). Only the right maxillary arch is shown. The white lines demarcate an approximate area of Lhx6 and Lhx8 expression during normal development, from which the mitotic indices in C were measured. (C) The comparison of mitotic indices between wild-type and Lhx6−/−;Lhx8−/− mutant embryos at three positions along the antero-posterior axis of the maxillary arch. The error bars are standard deviations of the data from three embryos per genotype. **P < 0.01, *P < 0.05 from Student's t-test.