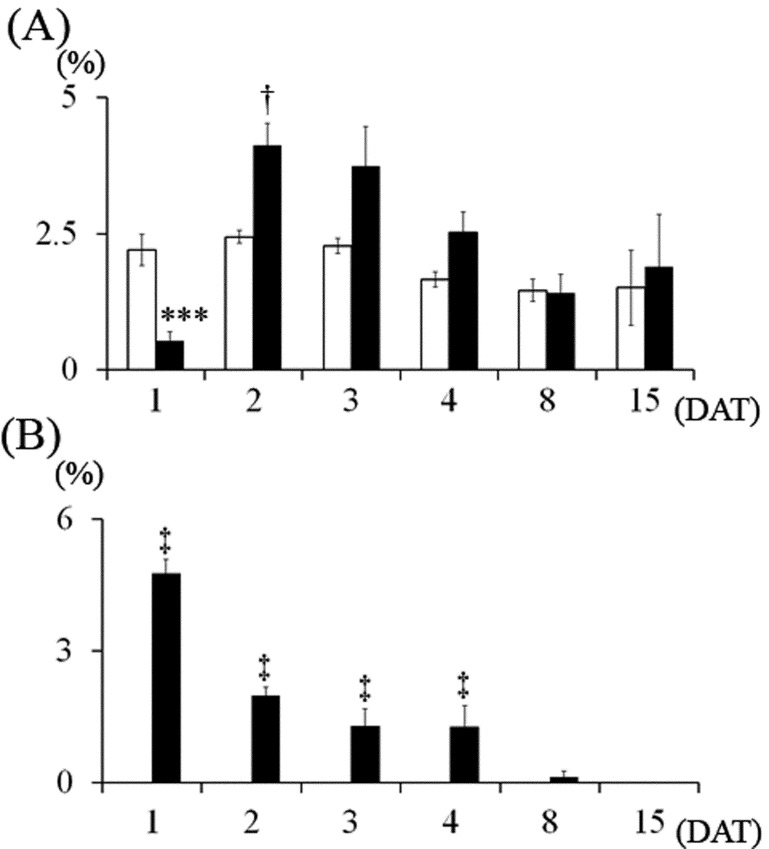
Fig. 11.
Changes in Phospho-Histone H3- and p21-indices in the external granular cells. (A) Phospho-Histone H3-index, (B) P21-index. Control group, MTX-treated group. Values are expressed as means ± SE. ***: Significantly different from control at P<0.001 (Student’s t-test). †: Significantly different from control at P<0.05 (Welch’s t-test). ‡: Significantly different from control at P<0.05 (Mann-Whitney’s U-test).

