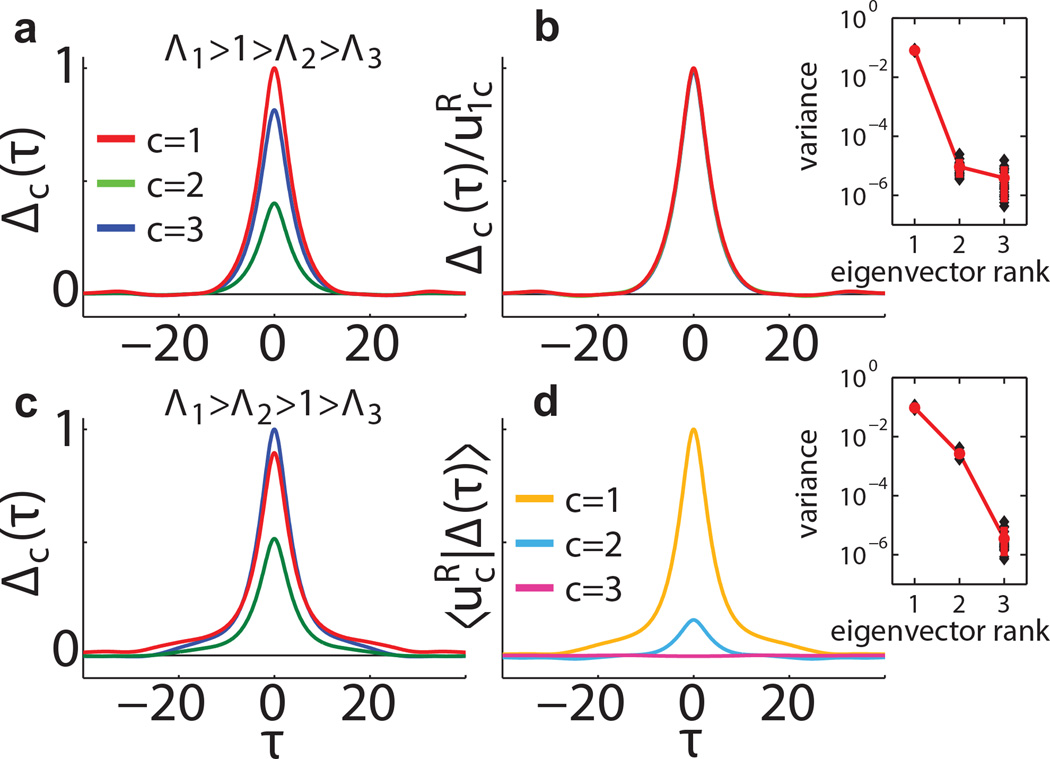
FIG. 2.
Autocorrelation modes. Example networks (N = 1200) have 3 equally sized groups with α, g such that M is symmetric. (a) When D* = 1 autocorrelations maintain a constant ratio independent of τ. (b) Rescaling by the components collapses the autocorrelation functions (Here Λ1 = 20, Λ2 = 0.2, Λ3 = 0.1). (c) When D* = 2, the autocorrelation functions are linear combinations of two autocorrelation “modes” that decay on different timescales. Projections of these functions are shown in (d). Only projections on are significantly different from 0 (Here Λ1 = 20, Λ2 = 16, Λ3 = 0.1). Insets show the variance of Δ (τ) projected on averaged over 20 networks in each setting.

