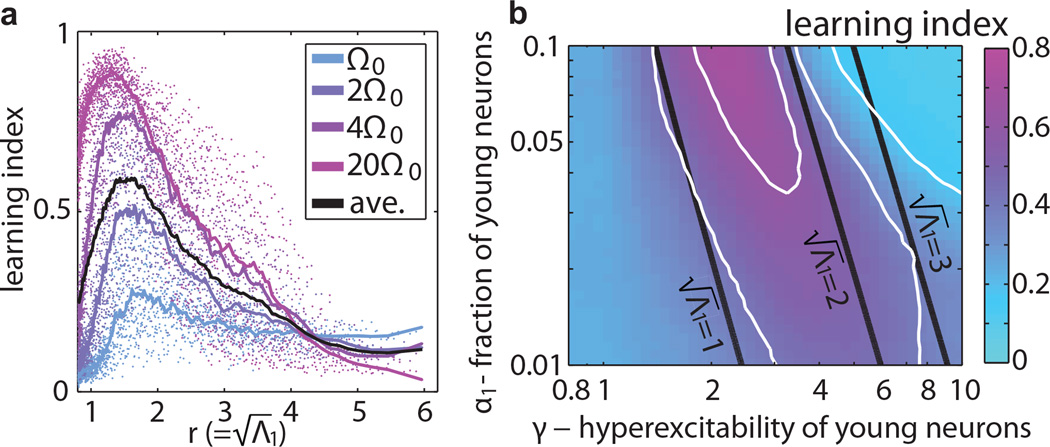
FIG. 3.
Learning capacity is primarily determined by , the effective gain of the network. (a) The learning index for four pure frequency target functions (Ω0 = π/120) plotted as a function of the radius . The training epoch lasted approximately 100 periods of the target signal. Each point is an average over 25 networks with N = 500, ε = 0.2 and different values of α1 and γ. The line is a moving average of these points for each frequency. (b) The same data averaged over the target frequencies shown as a function of γ and α1. Contour lines of lΩ (white) and of (black) coincide approximately in the region where lΩ peaks.

