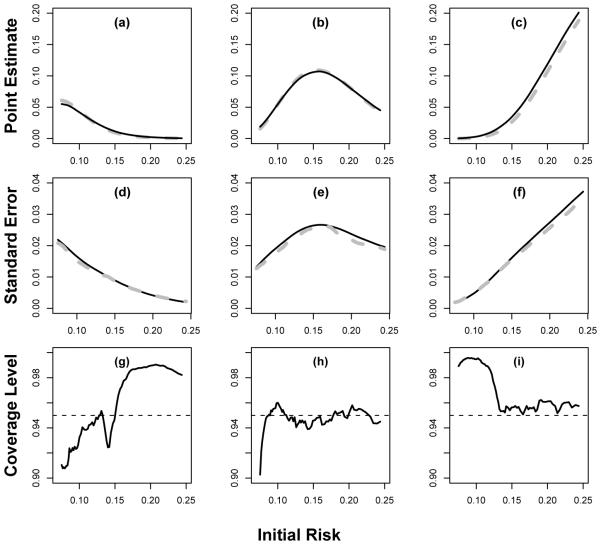
Fig. 3.
Performance of the proposed procedure under a mis-specified model with sample size 3000 where the underlying effect of CRP is twice as big as that estimated from CHS data: (a,b,c) the sample average of (solid curve) compared to the truth (gray dashed curve); (d,e,f) the average of the estimated standard errors (solid curve) for compared to the empirical standard error estimates (gray dashed curves); and (g,h,i) the empirical coverage of the 95% confidence intervals based on the proposed resampling procedures. The three columns represents l = 1, 2 and 3, respectively.

