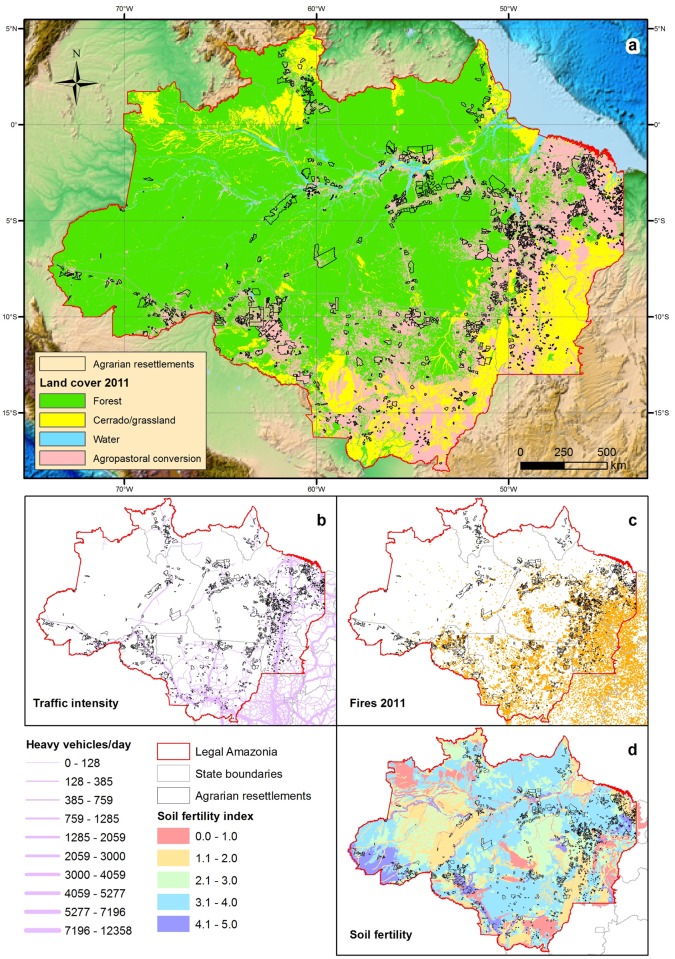
Fig 3. Agrarian reform settlement areas within Brazilian Legal Amazonia.
Main map showing (a) land cover as of 2011 and state administrative boundaries (topographic map background from [52]). Smaller maps show (b) the level of traffic intensity along major roads, expressed in terms of the number of heavy cargo and passenger vehicles per day, (c) the spatial distribution of fires (hot pixels) in 2011, and (d) major classes of agricultural soil fertility throughout the region.

