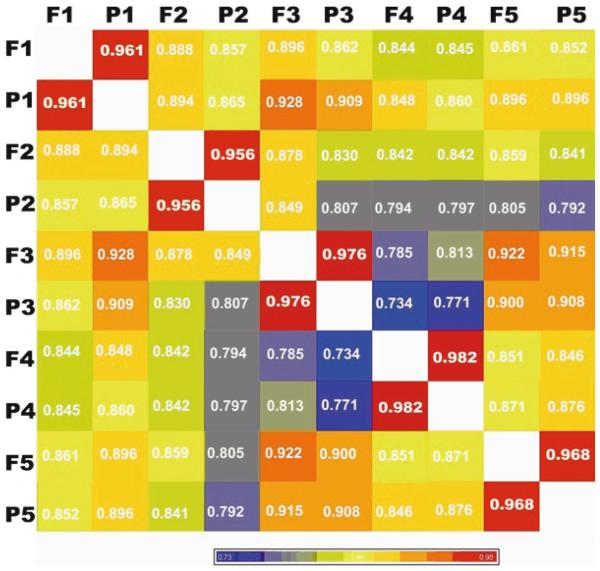
Fig. 2.
Pairwise Pearson’s correlations of miRNA expression between FFPE samples and matched fresh frozen. RNA from fresh frozen and matched FFPE tissues was profiled using a commercially available microarray platform. Mean miRNA intensity correlation between FFPE samples (indicated by P1, P2, P3, P4, P5) and fresh-frozen tissue samples (indicated by F1, F2, F3, F4, F5) is shown in the figure.

