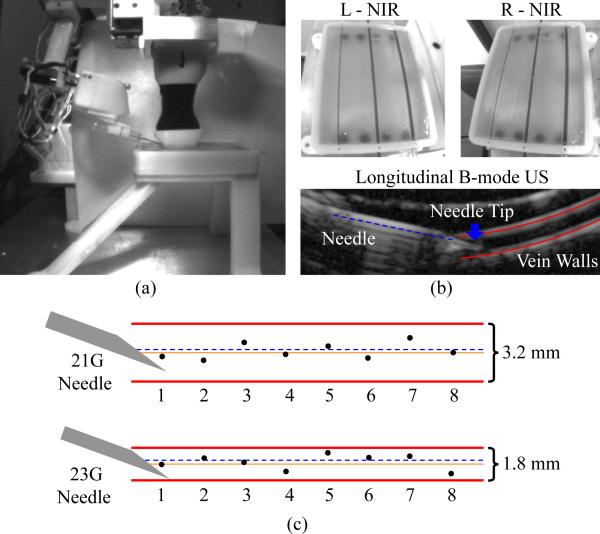
Fig. 11.
(a) Experimental setup for phantom cannulation testing. (b) Left and right NIR images of an in vitro tissue phantom (top), and longitudinal US image during a needle insertion on the ø1.8-mm vein (bottom). (c) Results from the cannulation study—orange solid line refers to the desired vein center and black dots indicate the actual location of the needle (at the center of the cannula opening) for each trial. The dashed blue line indicates the average position of the needle within the vein over the eight trials.

