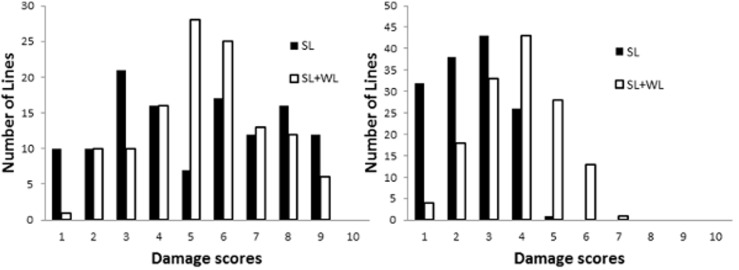
Fig 2. Distribution of salinity tolerance (damage scores) of DH lines under drained and waterlogged conditions in summer trials (A) and winter trials (B) (parental varieties included).

Solid bars: the number of individuals after four-week SalinityD treatment and hollow bars: the number of individuals after two-week SalinityW treatment. ‘Y’ = YSM1, ‘G’ = Gairdner.
