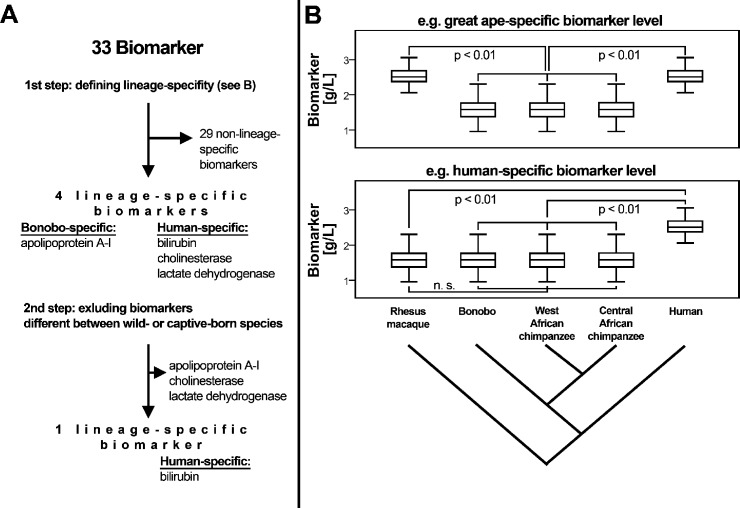
Fig 1. Flow chart of the analytic approach to identify lineage-specific biomarker levels.
A: differences in biomarker levels were sorted as specific to (i) humans, (ii) great apes, (iii) bonobos, (iv) chimpanzees, (v) Central African chimpanzees, (vi) West African chimpanzees and as (vii) non-lineage specific. B: Human-specific changes were defined as significant differences to chimpanzees and bonobos taken together (but not between the latter two species) as well as to rhesus macaques (shown); and as significant differences between humans and the individual great ape species (not shown), regardless of significant differences between species born and living under different environments. Relations of species as shown in cladograms derived from [103, 104].

