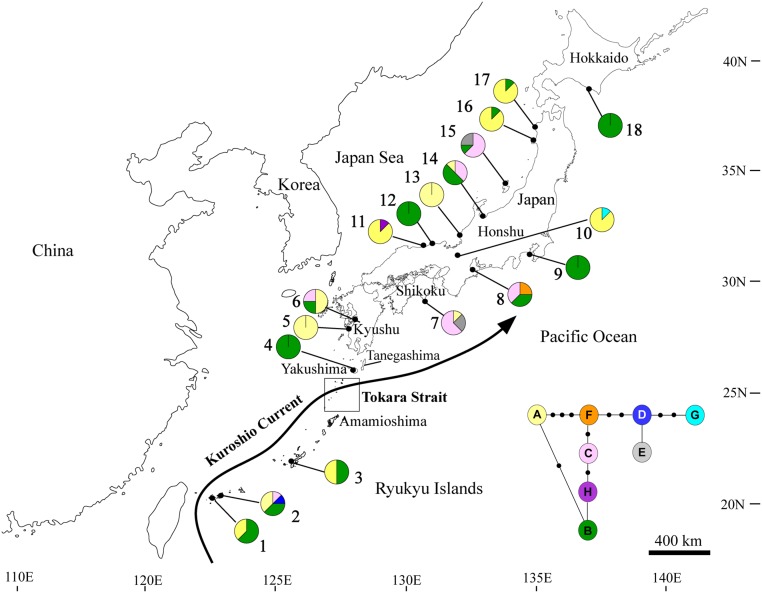
Fig 1. Sampling locations and distribution of chloroplast DNA haplotypes of 18 populations of wild radish sampled in Japan.
The pie charts indicate the haplotype frequencies and are color-coded, as for the parsimony network. Population numbers 1–18 correspond to those of Table 1. The square box indicates the Tokara Strait region and is modified from the graphic of Feng et al. [25]. The main path of the Kuroshio Current, modified from the graphic of Yin et al., is also shown [26].

