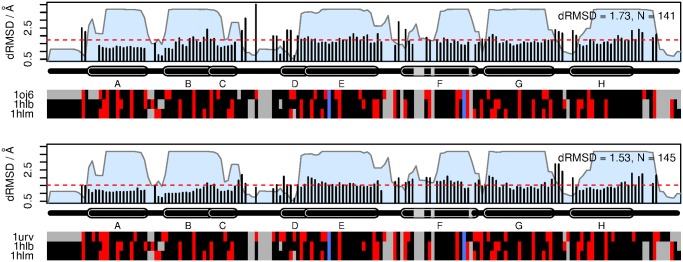
Fig 7. Analysis of average per-site root mean square deviation (RMSD) between the echinoderm structures (1hlb, 1hlm) and the Ngb (1oj6) and Cygb (1urv) structures.

Structural deviation was computed from each of the echinoderms to the target structure of interest as described in the Methods section, using the consensus alignment generated on the larger structural dataset; the mean of these two values computed for each column. Colored blocks at the bottom indicate charged (red) and non-charged (black) residues. Gaps are shown in grey, and the proximal and distal histidines are shown in blue. Helix locations are annotated above, and named using standard conventions. Overall RMSD for each plot is computed as the mean of the squared contributions from each site, and is indicated by the dashed red line. The blue areas underneath indicate the confidence associated with each column in the multiple alignment, as outputted by StructAlign.
