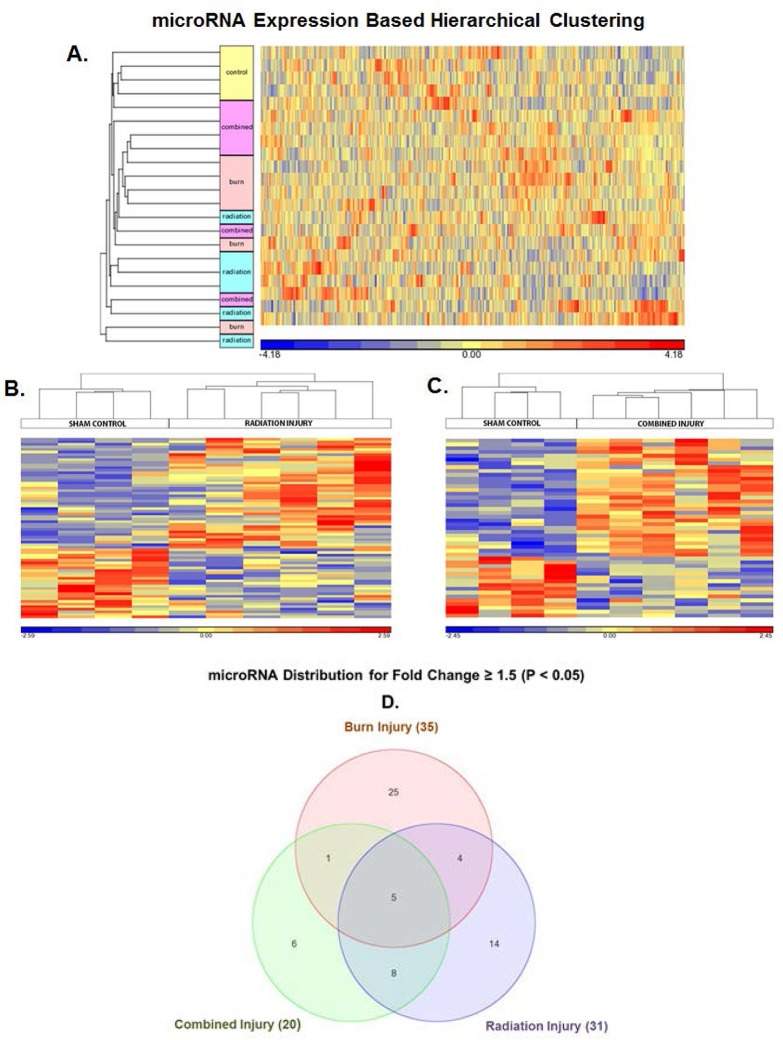
Fig 4. Identification of differentially expressed microRNA in serum exosomes of burn, RI and CI mice vs. control sham mice.
(A) Heat Map analysis of microarray data from female B6D2F1/J mice subjected to skin burn injury alone (BURN), whole-body ionizing irradiation alone (RI) or when combined with skin burn injury (CI) compared to experimental control mice (SHAM) at 30 days survival. Here all miRNAs that significantly changed with a fold change ≥ 1.2 were included in the analysis (p<0.05, n = 6). Results were generated using Partek Genomics Suite. The color code for the signal strength in the classification scheme is shown in the panel below. Induced genes are indicated by shades of red and repressed genes are indicated by shades of blue. (B) Heat Map showing variations in expression of 70 miRNAs in RI mice vs. control sham mice using a cut-off criteria of p<0.05 and fold change ≥ 1.2. (C) Heat Map showing variations in expression of 47 miRNAs in CI mice vs. control sham mice using a cut-off criteria of p<0.05 and fold change ≥ 1.2. (D) Partek Venn-Diagram showing differential miRNA distribution within the different mice injury groups vs. control sham mice using a cut-off criteria of p<0.05 and fold change ≥ 1.5.

