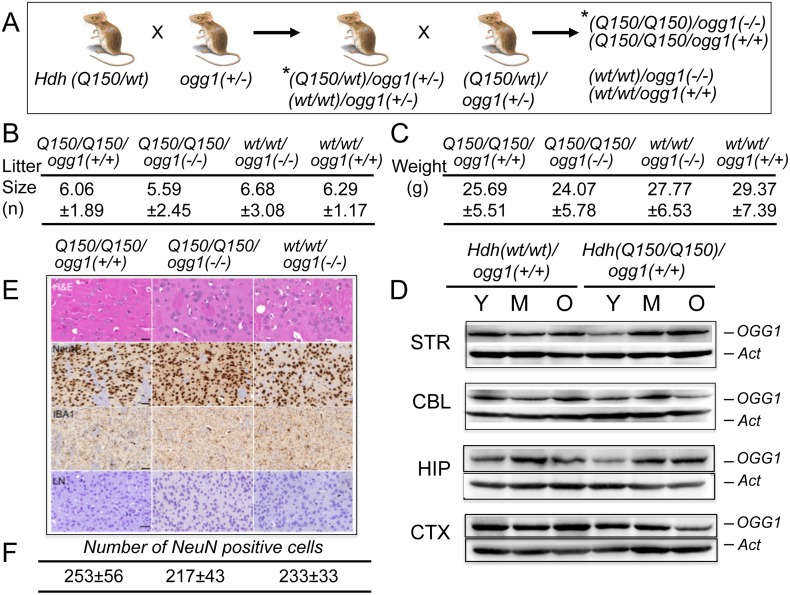
Fig 1. Hdh(Q150/Q150)/ogg1(+/+) and Hdh(Q150/Q150)/ogg1(-/-) animals are similar by physiological criteria.
(A) Schematic of crosses between Hdh(Q150/wt) and ogg1(+/-); (*) only a subset of the resulting genotypes from the breeding step are shown. The OGG1 (B) The average litter size for Hdh(Q150/Q150)ogg1(+/+), Hdh(Q150/Q150)ogg1(-/-), Hdh(wt/wt)/ogg1(-/-) and Hdh(wt/wt)/ogg1(+/+) genotypes. (C) The average weight (grams) for Hdh(Q150/Q150)ogg1(+/+), Hdh(Q150/Q150)ogg1(-/-), Hdh(wt/wt)/ogg1(-/-) and Hdh(wt/wt)/ogg1(+/+) animals at 25 weeks. A full table of weights and litter sizes for all nine genotypes are presented in S1 Table (in S2B Fig). (D) OGG1 resolved on an SDS-PAGE gel migrates as a 41 kDa (368 aa) protein. The age-dependence of OGG1 protein expression relative to actin controls: Y is 7–10 weeks, M is 12–16 weeks; O is greater than 30 weeks. The brain regions are; STR is striatum, CBL is cerebellum, HIP is hippocampus, CTX is cortex, as indicated. (E) Histological analysis of brain slices (caudate-putamen) from Hdh(Q150/Q150)ogg1(+/+), Hdh(Q150/Q150)ogg1(-/-), and Hdh(wt/wt)/ogg1(-/-) at 7–16 weeks. H&E is Hematoxylin and Eosin, which visualize protein and nucleic acid-rich regions, NeuN detects neurons, IBA1 is ionized calcium binding adaptor molecule 1, which detects microgliosis, and LN (Luxol-Nissl) stain detects overall cellular pattern and morphology. Scale bar is 50μm. Quantification of neurons by NeuN staining comprised 3 animals, 5–10 tissues slices and 10 random fields on each slice. (F) Quantification of the number of NeuN positive cells from digital images of brain slices of each of the three indicated genotypes. Shown are the histological analysis for only three genotypes that are most likely to exhibit pathophysiology. None of the genotypes displayed differences relative to controls.

