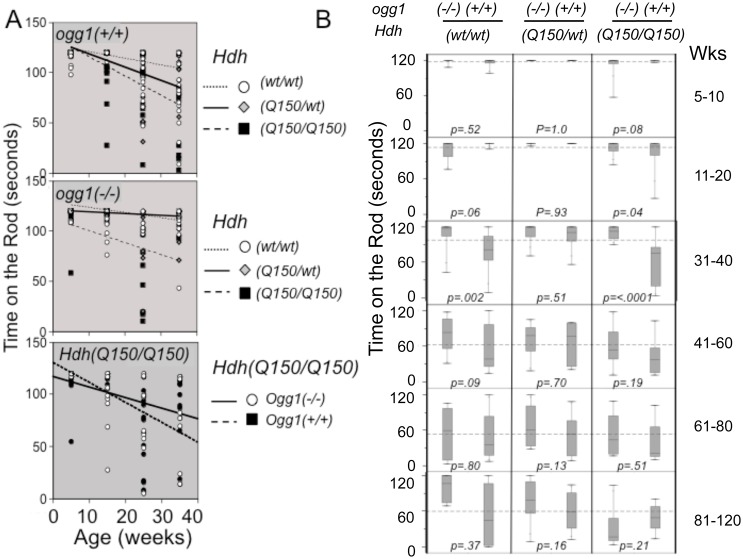
Fig 4. Suppression of somatic expansion delays motor decline in animals with similar inherited repeats.
(A) The trends of motor decline versus genotype, as judged by linear fits of the averages. Motor performance in animals is affected by the mHTT and OGG1 genotype in an opposite manner. (top panel) Motor decline depends on the complement of mHTT in the presence of OGG1. (middle panel) Loss of two OGG1 alleles suppresses the average motor decline in Hdh(Q150/150)/ogg1(-/-) animals that express only one mHTT allele. (lower panel) Direct comparison of the motor decline in Hdh(Q150/150)/ogg1(+/+) and Hdh(Q150/150)/ogg1(-/-) littermates. Points are plotted mid-range of the age group, ie. 15 weeks is representative of the whole 11–20 week age group. (B) Box and whisker plots for rotarod performance (time on the rod) versus Hdh and ogg1 genotypes. The thin vertical lines (whiskers) represent the entire distribution of performances at the indicated ages (see S6B Fig). Boxes represent the median 50% of performance values, with 25% above the median and 25% below the median. The horizontal line in the box indicates the median. The dotted horizontal line across the plot in each age group is the global average of performances when all 6 genotypes are combined. N = 16–20 animals per age group per genotype. Motor function was measured using a rotarod apparatus with a fixed-speed protocol described previously [36, 49, 50].

