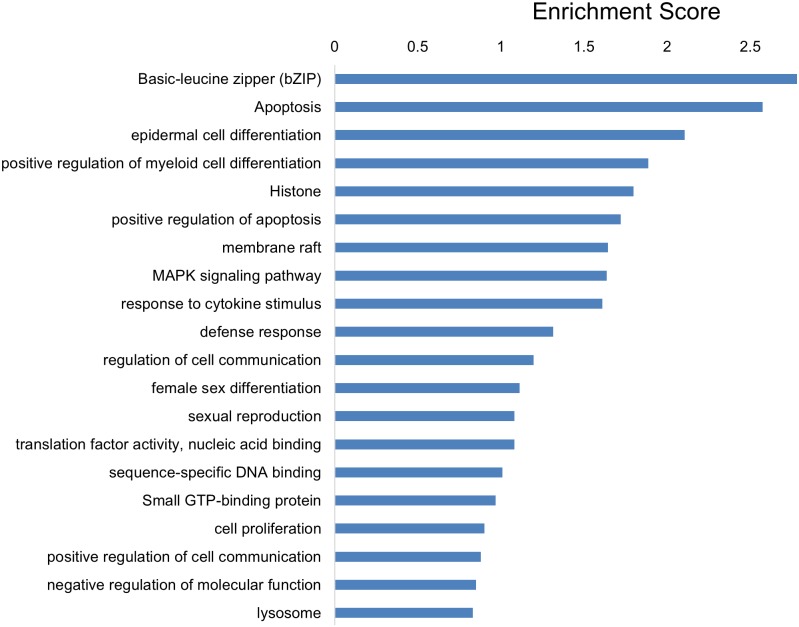
Fig 3. Functional Annotation Clustering analysis for differentially expressed genes in antago-103/107 treated HLEKs when compared with Ir-antago treated HLEKs.
The clustering analysis was performed by DAVID Functional Annotation Bioinformatics Resources v6.7. The rank is based on the Enrichment score, which represents mean p-value (in –log scale).

