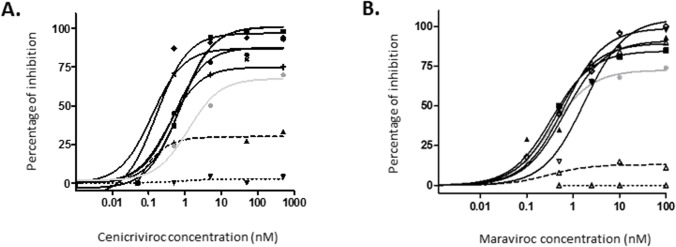
Fig 1. Dose response curves for cenicriviroc-dependent inhibition (A) and maraviroc-dependent inhibition (B).

R5, dual and X4-tropic HIV-2 strains are depicted in continuous, dashed and dotted black lines, respectively. HIV-1 R5-tropic strain is depicted using the continuous gray line.
