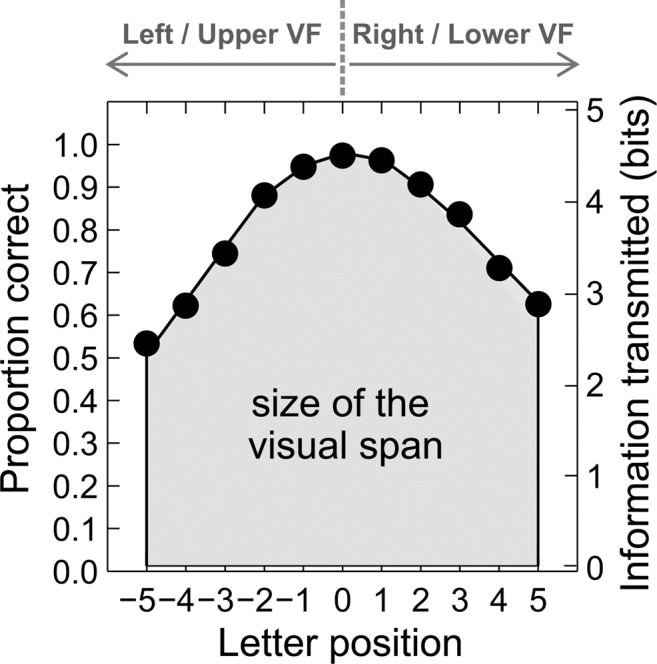
Figure 2.

A sample visual-span profile—a plot of letter-recognition accuracy (proportion correct) as a function of letter position. The right vertical scale shows a conversion from proportion correct to information transmitted in bits. The area under the curve indicates the size of the visual span.
