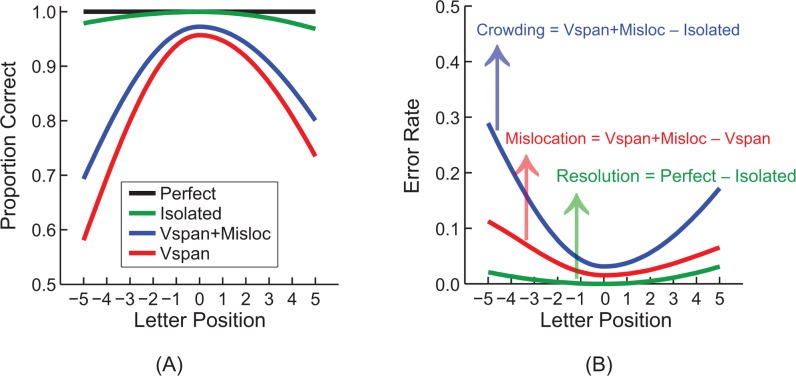
Figure 3.
(A) Sample profiles (proportion correct plotted as a function of letter position) used in the decomposition analysis—the perfect profile corresponds to 100% recognition performance; the isolated profile is for the recognition of single letters; the visual-span profile (the red curve labeled as “Vspan”) is for the identification performance in the trigram test; and the mislocation-corrected visual-span profile (the blue curve labeled as “Vspan+Misloc”) is for the trigram identification performance without considering localization accuracy. (B) Examples of difference curves (error rate plotted as a function of letter position). The green curve is obtained by subtracting the isolated-letter profile from the perfect profile. The area under the green curve shows the reduction in performance due to decreased acuity. The blue curve, a plot of the difference between the isolated-letter profile and the mislocation-corrected visual-span profile, represents the effect of crowding. The red curve shows the decrease in performance due to mislocation errors.

