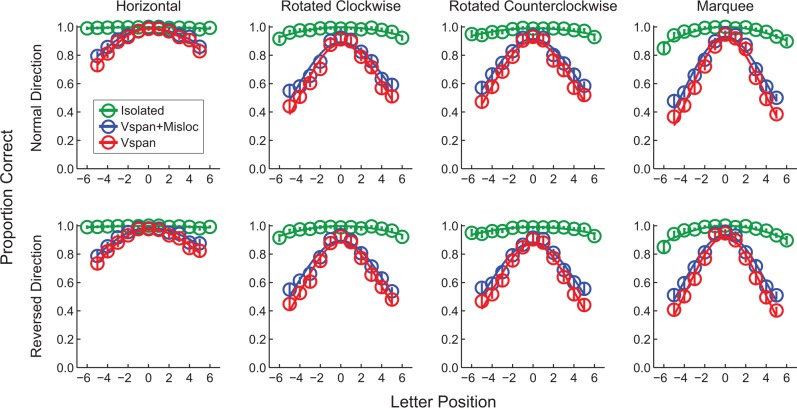
Figure 5.
Isolated-letter profiles, mislocation-corrected visual-span profiles, and visual-span profiles (group average) are shown for both normal and reversed reporting directions in the four text formats. The profiles consist of plots of letter-recognition accuracy as a function of letter position (data are available at 13 positions for isolated-letter profiles and at 11 positions for visual-span profiles). Data for each measurement and condition are fitted with split Gaussians. The error bars indicate standard errors.

