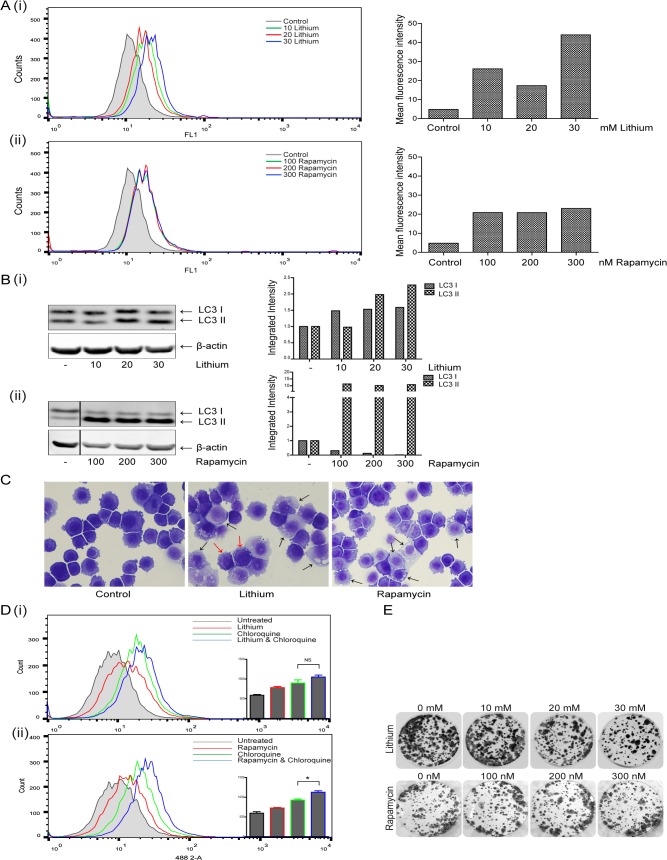
Fig 1. Evaluation of the effects of Lithium and Rapamycin on autophagy induction in esophageal cancer cells.
(A) KYSE450 cells were treated with lithium chloride (lithium) (10–30 mM) or rapamycin (100–300 nM) for 24 and 48 hours. Cells were assessed for autophagy induction 24 hours after treatment with lithium (i) or rapamycin (ii) with the Cyto-ID autophagy detection kit. Panels on the left show representative images of FACS analysis, with panels to the right showing corresponding mean fluorescence intensity. Data shown here is representative of three independent experiments. (B) Western blot analysis of LC3 expression in cells treated with lithium (i) or rapamycin (ii) for 24 hours. LC3I and LC3II bands were quantified using the Odyssey Infrared Imaging System (Li-COR), normalized to β-actin and presented as integrated intensities. (C) Morphological features of KYSE450 cells following lithium (30 mM, center panel) or rapamycin (300 nM, right hand panel) treatment for 24 hours. Black arrows indicate accumulation of vesicles in both lithium and rapamycin treated cells, red arrows denote peripheral vesicle accumulation (Magnification 40x). (D) Cells were pretreated with chloroquine (10 μM) for two hours, prior to treatment with lithium (10 mM) (i) or rapamycin (100 nM) (ii) for 48 hours and autophagy levels assessed with the Cyto-ID autophagy detection kit. Representative images of FACS analysis are shown (n = 3), with inset bar graphs showing corresponding mean fluorescence intensity (* p < 0.05). E Viable cells following treatment with either lithium or rapamycin for 48 hours were counted and equal numbers (1,500 cells per well) reseeded in triplicate, in the absence of drug. Cells were allowed to grow for 14 days, then were fixed and stained and colony regrowth assessed.

