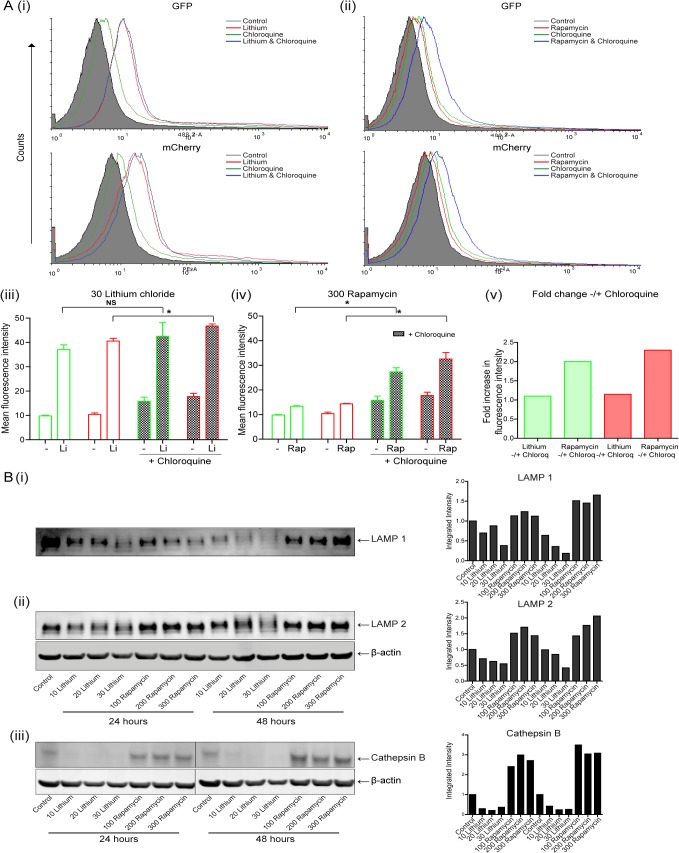
Fig 3. Examination of the autophagosome processing in esophageal cells following treatment with lithium or rapamycin.
(A) KYSE450 cells were transfected with pBABE-puro mCherry-EGFP-LC3B expression plasmid. Twenty four hours later, cells were treated with lithium (30 mM) or rapamycin (300 nM) alone or in the presence of chloroquine (10 μM) for 48 hours. Following treatment, cells were harvested and analysed by flow cytometry for EGFP (488 2-A) and mCherry (PE-A) expression. Representative histograms of GFP (upper) and mCherry (lower) for both lithium (i) and rapamycin (ii) treated cells, without (red overlays) and with chloroquine (blue overlays) are shown. Data is presented as mean fluorescence intensity (MFI) of three independent experiments for both GFP and mCherry in lithium (iii) and rapamycin (iv) treated cells (n = 3). The fold change in GFP (green bars) and mCherry (red bars) MFIs between lithium or rapamycin, without and with chloroquine is presented to the right (v). Asterisks indicate a significant difference in the MFI (* p < 0.05). (B) Western blot analysis of LAMP 1 (i), LAMP 2 (ii) and cathepsin B (iii) expression in cells treated with lithium (10–30 mM) or rapamycin (100–300 nM) for 24 and 48 hours. All bands were quantified using the Odyssey Infrared Imaging System (Li-COR), normalized to β-actin and presented as integrated intensities.

