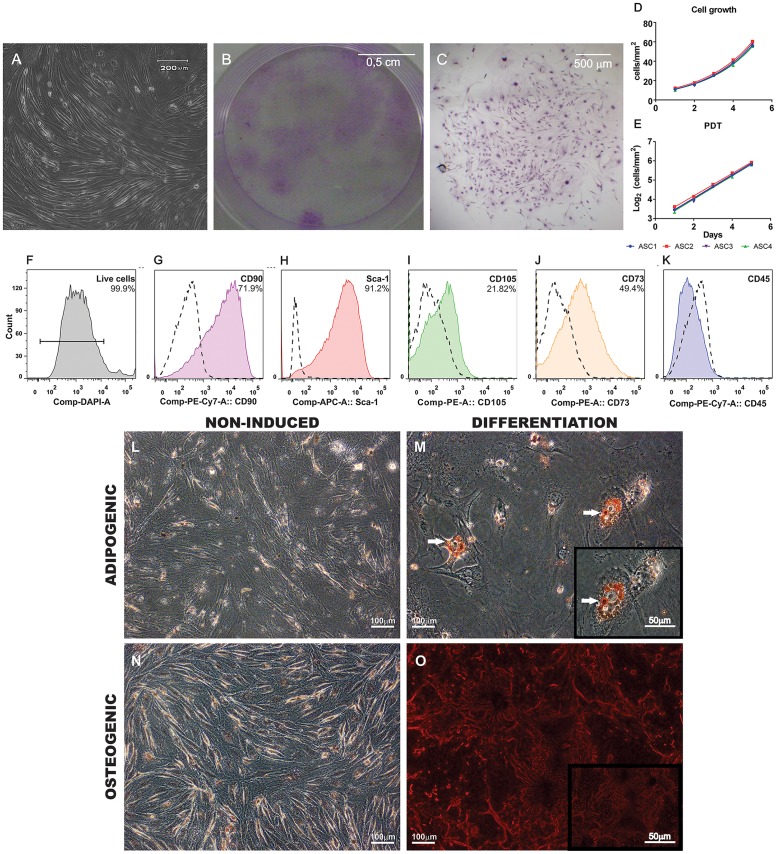
Fig 1. Characterization of ASC.
(A) ASC were adherent to culture flaks and exhibited a fibroblast-like spindle-shaped morphology. (B) Macroscopic view of CFU-F assay showing colonies of ASC stained by Giemsa. (C) Microscopic view exemplifying one colony of ASC also stained by Giemsa. Growth of ASC in culture was exponential (D) and the curves were converted to logarithmic scale (E) to calculate population doubling time (PDT) (n = 4 in all experiments). (F-K) Histograms showing the immunophenotype of ASC by flow cytometry. (F) Dead cells were excluded from the analysis by DAPI staining. (G-K) Dashed lines represent isotype controls and the percentage of positive events is shown on the right upper quadrant. Cells were predominantly positive for CD90.2 (G) and Sca-1 (H). Expression of CD105 (I) and CD73 (J) was lower. No hematopoietic contaminants were observed since cells were negative for CD45 (K). (L-O) Differentiation of ASC. (L and N) Negative controls. Cells were cultured for 21 days in standard expansion culture medium. (M) ASC cultured in adipogenic conditions exhibited lipid vacuoles in their cytoplasm shown by Oil Red O staining (white arrows). (O) Cells cultured in osteogenic conditions exhibited calcium deposits in the extracellular matrix stained by Alizarin Red. Inserts show higher magnification images of M and O.

