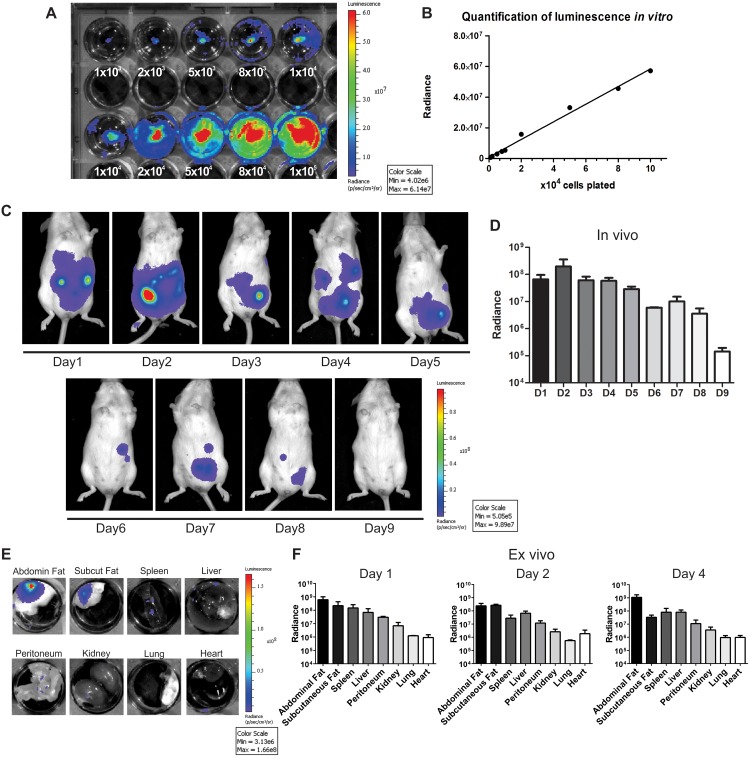
Fig 2. Cell tracking by bioluminescence.
(A) Evaluation of luminescent signal intensity in ASC transduced with the Luciferase 2 gene in vitro. Numbers shown below the wells indicate the amount of cells. (B) The signal increased with cell numbers in a linear fashion (R2 = 0.9914). In vivo images (C) and quantification (D) (n = 3) of the luminescent signal showed that cells remained in the abdominal region and that there was a progressive decrease in radiance with time. The signal disappeared within 9 days of cell injection. Ex vivo images (E) and quantification (F) (n = 3 per day) of the luminescent signal demonstrated that the majority of the cells migrated to the abdominal or subcutaneous fat. The signal was lower in other abdominal organs, such as the spleen and liver, and virtually absent in thoracic organs such as the heart and lungs. Quantification data in D and F are shown in logarithmic scale.

