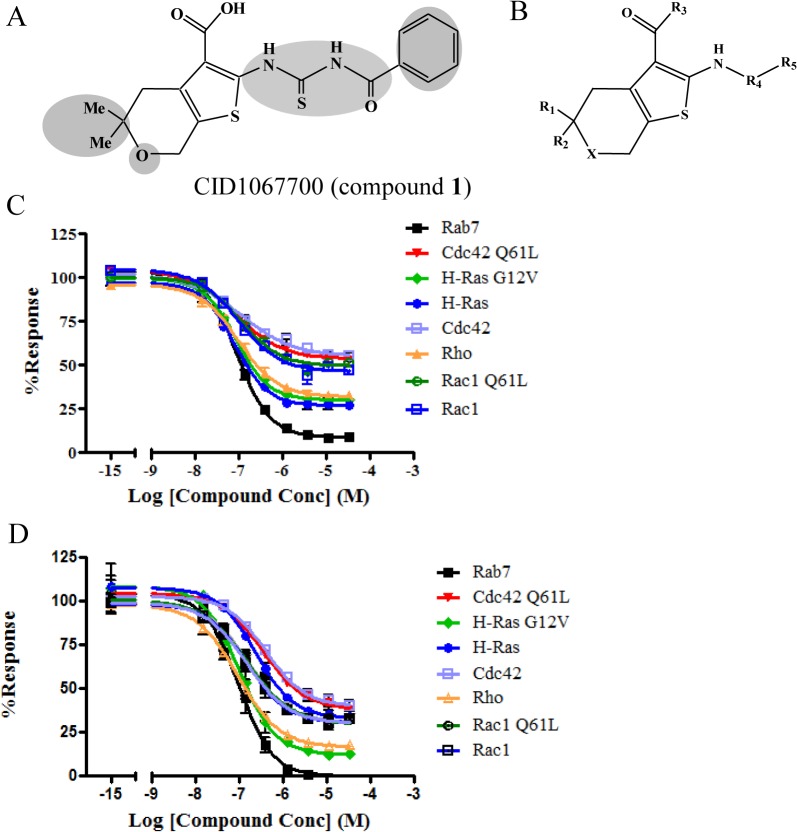
Fig 1. Compound 1 structure and dose-response curves.
(A) Structure of 1 and sites of functionalization. Shaded areas are modified regions for SAR. (B) General structure of compound 1 and analogues. (C) The concentration dependence of compound 1 on BODIPY- FL GTP binding to eight GTPases. (D) The concentration dependence of compound 1 on BODIPY-FL GDP binding to eight GTPases. Data shown in (C) are representative of at least three independent sets of measurements with each set conducted in duplicate. All the data points from each set were used to fit the sigmoidal dose-response equation. Percent response was calculated as the ratio of (sample MCF–negative control MCF) / (positive control MCF–negative control MCF). For the positive control, DMSO instead of the compound was added; for the negative control, the compound was replaced with GTP at a concentration 5000 fold greater than BODIPY-FL GTP. MCF stands for median channel fluorescence.

