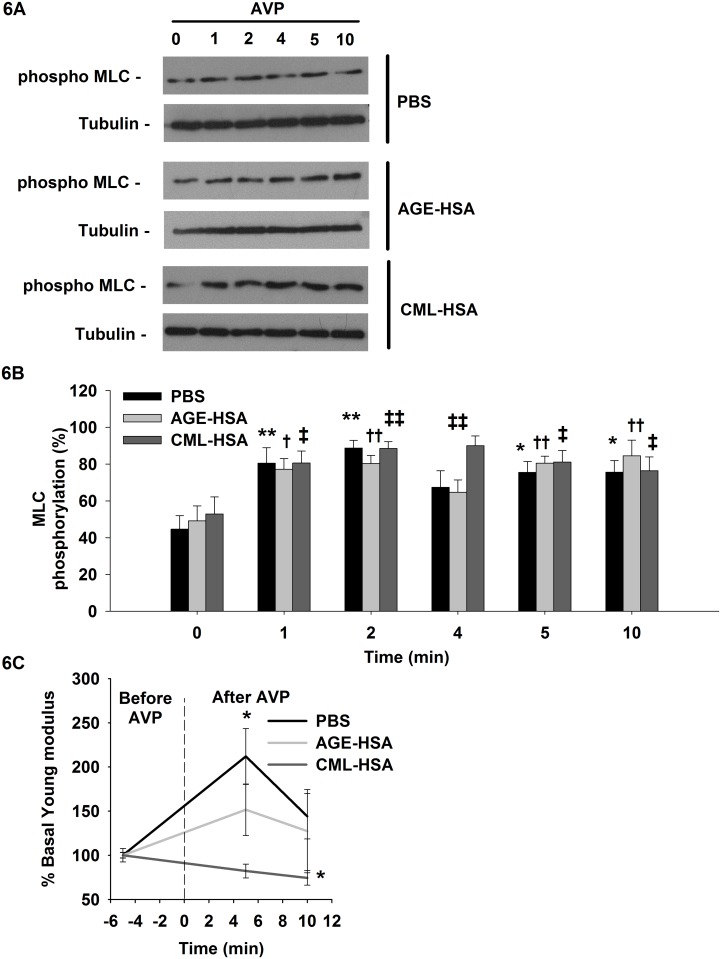
Fig 6. RAGE signaling affects myosin phosphorylation and cell contraction induced by AVP stimulation.
A, immunoblots indicate the phosphorylated levels of MLC and (B) semi-quantitative analysis of the pMLC activity in A7r5 cells stimulated 24 hours with 1 mg/ml AGE-HSA or 1 mg/ml CML-HSA. Each bar represents 11–12 independent experiments, and tubulin was used as the loading control for MLC activity determination. The data were normalized based on the corresponding tubulin loading control and then expressed as a % relative to the maximum phosphorylation value. * p < 0.05 compared with the respective control (0 min) using one-way ANOVA followed by Bonferroni post-test. C, Graph indicates the changes in Young modulus as measured by AFM. A7r5 cells stimulated 24 hours with 1 mg/ml AGE-HSA, 1 mg/ml CML-HSA or PBS were probed 5 min prior to stimulation to obtain basal values; the same cells were subsequently probed 5 min and 10 min after 200 nM AVP stimulation. The data are expressed as the % changes in the cell rigidity compared with the respective control (-5 min). Each condition represents 12–15 independent experiments. * p < 0.05 compared with the control (-5 min) using one-way ANOVA followed by Dunn’s post-test.

