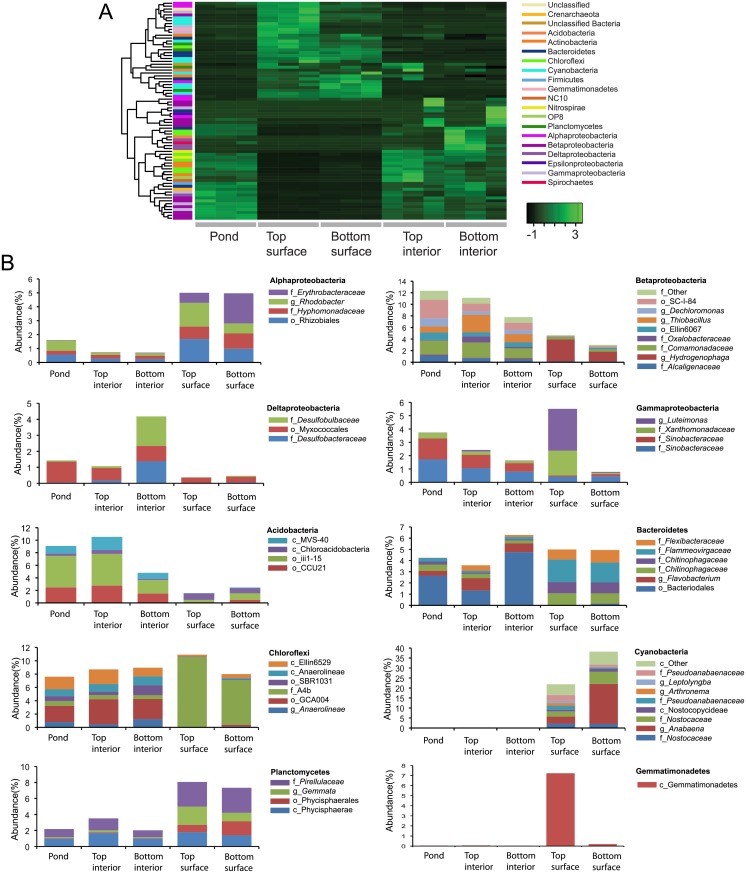
Fig 5. Structure of the surface, interior and pond communities.
OTUs were taxonomically assigned and filtered to include only genera that represent at least 1% of the community of at least one sample. A) Relative abundances were normalized, and heatmaps were generated to show Z-scores. Rows were clustered according to abundance pattern. Each row represents a unique genus and the colored bar on the left represents the phylum to which it belongs. B) Relative abundance of genera in the pond, surface and interior, grouped by phylum. Each colored portion of the stacked bars represents a unique genus, however the taxonomic name given in the keys is for the lowest named taxonomic rank to which the genus belongs. For clarity, the prefixes c_,o_, f_, and g_ are used to denote class, order, family and genus, respectively. Note that only the most abundant genera are shown, so the sum of the genera for a particular phylum does not necessarily represent the total abundance for that phylum.

