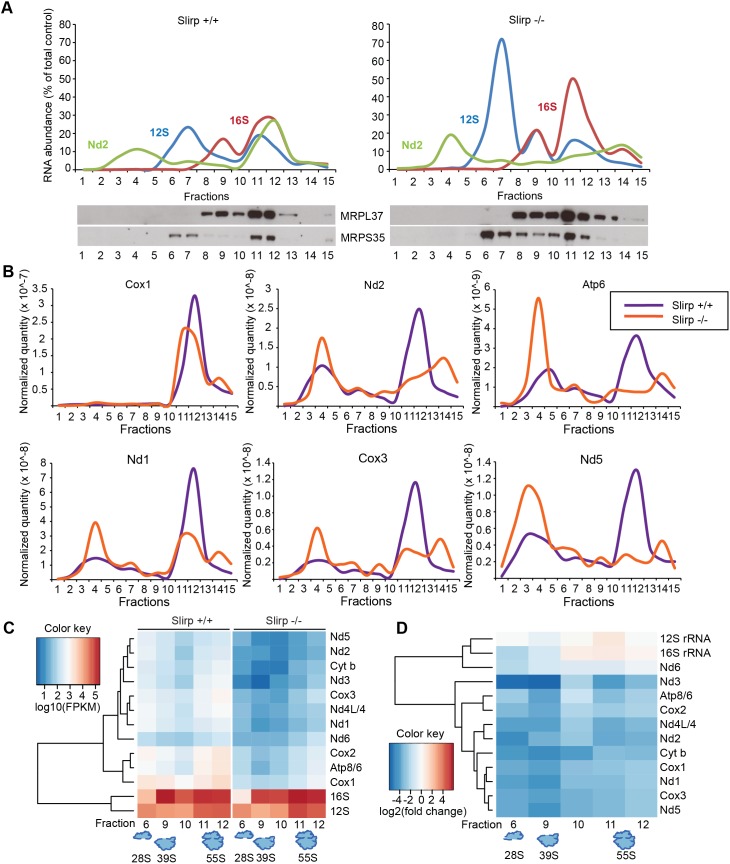
Fig 2. SLIRP loss affects the engagement of mitochondrial mRNAs with the mitochondrial ribosome.
(A) Sedimentation profile in sucrose density gradient of transcripts and ribosomal proteins from liver mitochondria from 12-week old wild-type (Slirp +/+, left panel) and Slirp homozygous knockout (Slirp -/-, right panel) animals. Individual mitochondrial transcripts were detected by qRT-PCR. The abundance of a given RNA in each fraction is shown as percentage of the total level in the control. The migration of the small (28S) and large (39S) mitochondrial ribosomal subunits, and of the assembled mitochondrial ribosome (55S) is assessed by the profiles of the 12S (blue line) and 16S (red line) rRNAs as well as by the migration of subunit-specific ribosomal proteins (MRPL37 and MRPS35) detected by immunoblotting. (B) Individual mRNA sedimentation profiles from the gradient described in (A). Slirp +/+ profiles are depicted in purple and Slirp -/- profiles are depicted in orange. Individual mitochondrial mRNAs were detected by qRT-PCR and the mRNA distribution profile is shown after normalization to controls, i.e. the quantity of a given mt-mRNA, named RNAx, in each fraction of the Slirp -/- gradient was normalized to the total RNAxSlirp+/+/total RNAxSlirp-/- ratio, where total RNAx is the sum of the RNAx quantity detected across all the fractions. (C) Hierarchical clustered expression levels of mitochondrial transcripts (log10FPKM) across all fractions from both Slirp +/+ and Slirp -/- mitochondria. (D) Hierarchical clustered log2 fold changes in transcript expression for each fraction, showing the overall decrease in mRNA levels of Slirp -/- compared to Slirp +/+ mitochondria.

