
Fig 5. Distribution of euclidean distances between sample M-values.
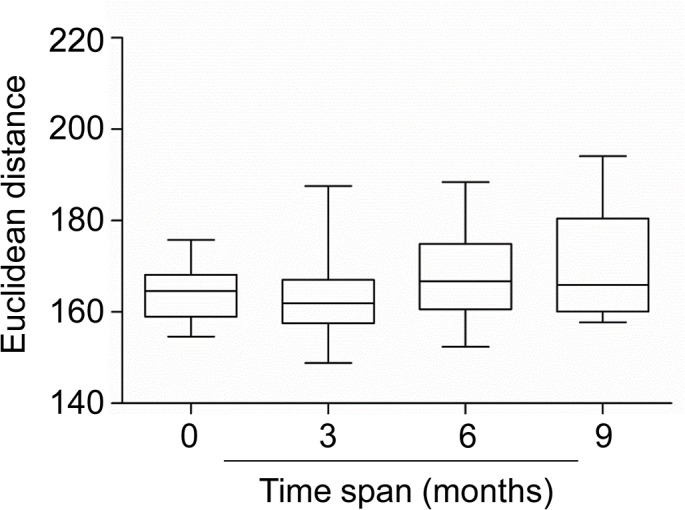
From left to right Euclidean distance between samples collected from the same individuals 0 month (N = 15 pairs, mean Euclidean distance = 163.9, based on the dataset containing independent 6 replicates from Subject E at 9 months), 3 months (0 months vs. 3 months, 3 months vs. 6 months, & 3 months vs. 9 months, N = 22 pairs, mean Euclidean distance = 163.9), 6 months (0 months vs. 6 months & 3 months vs. 9 months, N = 15 pairs, mean Euclidean distance = 168.8), and 9 months (0 months vs. 9 months, N = 8 pairs, mean Euclidean distance = 171.0) apart. Black lines within each box represent the median of the Euclidean distances. Boxes represent the inter-quartile range. The statistical analysis was performed using a non-parametric equivalent of one-way analysis of variance (ANOVA), the Kruskal-Wallis test, followed by a Bonferroni's/Dunn's multiple comparison test.