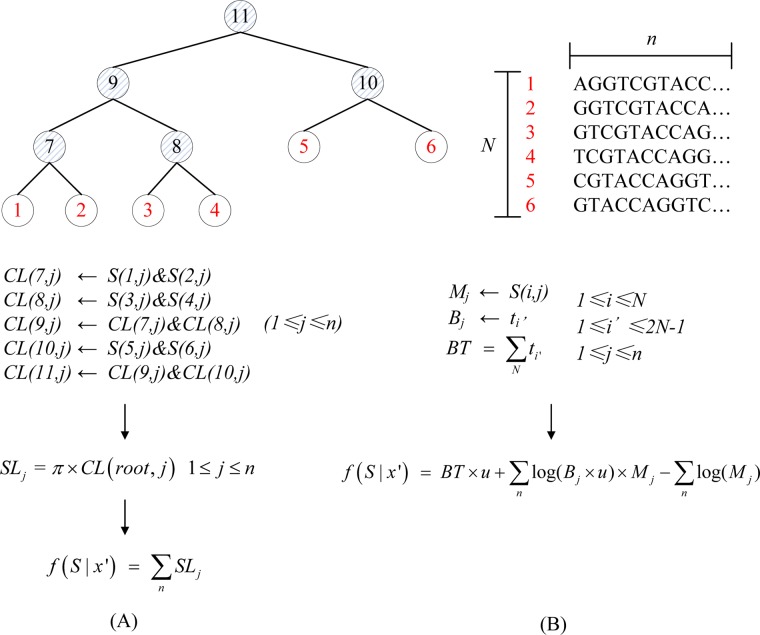
Fig 3. Illustration of likelihood evaluation for HKY model and IS model.
N denote the number of individuals in population for analyses and n denote the length of sequences. The circles in shadow are the non-leaf nodes and the circles with red number are the leaf nodes in phylogenetic tree. (A) S(i,j) denote jth base of ith sequence, CL(i,j) denote conditional likelihood of jth base for ith node, SL j denote site likelihood for jth base, f(S | x’) denote global likelihood. (B) S(i,j) denote the jth base of ith sequence, M j denote the number of mutations of jth base, B j denote branch length of jth base, t i denote branch length of ith node, BT denote total branch length for phylogenetic tree, f(S | x’) denote global likelihood.

