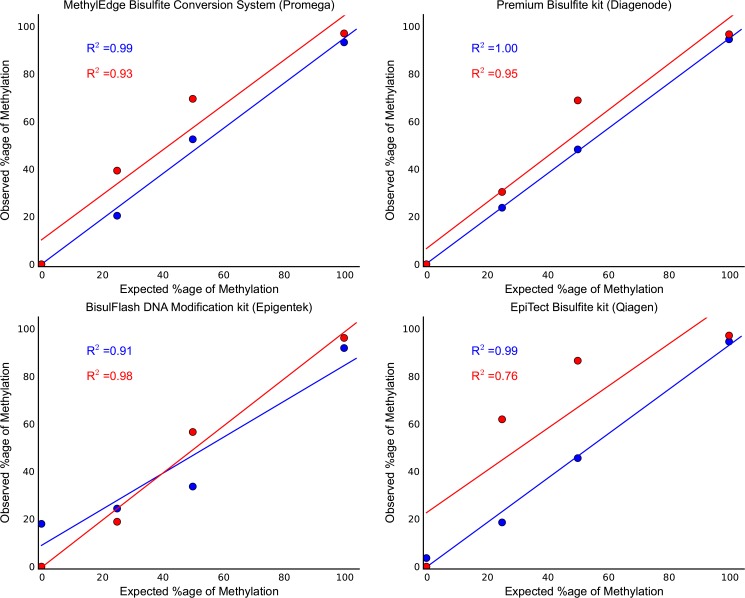
Fig 5. Bisulfite amplicon sanger sequencing.
Standard curves were generated by sanger methylation quantification of known methylation level controls. The expected percentage of methylation was plotted versus the observed one. Points represent the mean methylation level of the fifteen and eleven CpG sites for the two regions, respectively, as analyzed with Sanger/ESME (blue line = Lambda control 1, red line = Lambda control 2). Both λ-DNA controls were able to fit linear lines with R2 values as presented. The correlation coefficients are higher in the data generated from the Premium Bisulfite kit (Diagenode) and the MethylEdge Bisulfite Conversion System (Promega). [P value for i) Lambda control 2 (Qiagen) = 0.1309, ii) rest of samples < 0.05].

