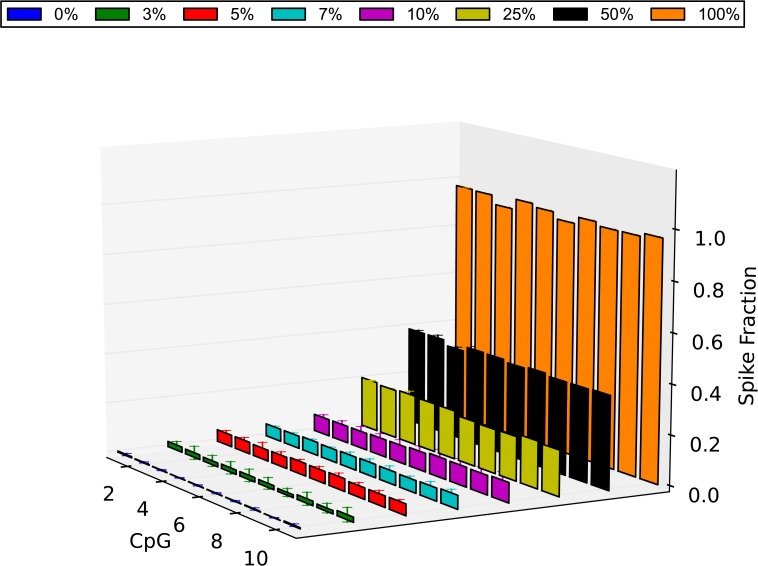
Fig 7. Methylation level of λ-DNA control as determined by NGS.
The methylation level of all the CpG sites of the amplified region of the λ-DNA control 2 is plotted for all the spikes. Shown is the average value of each CpG in each spike as was calculated from 3 technical replicates (methylated λ-DNA 0% = blue, 3% = green, 5% = red, 7% = light blue, 10% = purple, 25% = yellow, 50% = black, 100% = orange). In order to calculate statistical significance of the methylation level of each spike, we created a dataset of average performance for each spike group and we compared these average performance datasets with the 100% unmethylated average performance set using a t-test. It was demonstrated that all the small-percentage spikes showed significantly higher methylation levels than the 0% methylated group [3% (P = 2.704e-11), 5% (P = 1.685e-21), 7% (P = 1.181e-23), 10% (P = 2.991e-19)]. Errors bars = SD

